In the climograph below, biomes are plotted by their range of annual mean temperature and annual mean precipitation. Identify the following biomes: Arctic tundra Coniferous forest Desert, grassland Temperate forest, Tropical forest. Explain why there are areas in which biomes overlap on this graph.
Verified step by step guidance
1
Examine the climograph provided. Each labeled region (a, b, c, d, e, f) represents a biome based on its range of mean annual temperature (°C) and mean annual precipitation (cm). Identify the biomes by matching their environmental conditions to the graph.
Label 'a' corresponds to the desert biome, characterized by low precipitation (less than 100 cm annually) and high temperatures (up to 30°C). Deserts are typically dry and hot.
Label 'b' corresponds to the grassland biome, which has moderate precipitation (around 100-200 cm annually) and temperatures ranging from 0°C to 30°C. Grasslands are found in regions with seasonal rainfall.
Label 'c' corresponds to the tropical forest biome, which experiences high precipitation (300-400 cm annually) and warm temperatures (above 20°C). Tropical forests are located near the equator and have consistent rainfall.
Biomes overlap on the graph because environmental conditions such as temperature and precipitation can vary within a biome, creating transitional zones. For example, grasslands may share characteristics with deserts or temperate forests depending on local climate variations.
Verified video answer for a similar problem:
This video solution was recommended by our tutors as helpful for the problem above
Video duration:
3m
Play a video:
Was this helpful?
Key Concepts
Here are the essential concepts you must grasp in order to answer the question correctly.
Climograph
A climograph is a graphical representation that displays the relationship between temperature and precipitation in a specific area over a year. It helps in visualizing climate patterns and understanding how these factors influence the distribution of biomes. By plotting mean annual temperature against mean annual precipitation, climographs can illustrate the conditions that define different ecosystems.
A biome is a large ecological area on the Earth's surface, characterized by specific climate conditions, flora, and fauna. Examples include tundra, forests, deserts, and grasslands. Each biome has distinct temperature and precipitation ranges that support particular types of vegetation and animal life, which can be identified on a climograph based on their respective climatic conditions.
Biome overlap occurs when different biomes share similar ranges of temperature and precipitation, leading to areas where their characteristics can blend. This can happen due to transitional zones, where environmental conditions are not strictly defined, allowing for a mix of species and ecosystems. Understanding this overlap is crucial for studying biodiversity and ecological interactions within these regions.


 Verified step by step guidance
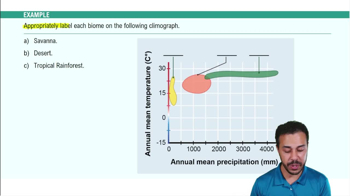
 03:03
03:03