Join thousands of students who trust us to help them ace their exams!
Multiple Choice
Which of the following graphs best corresponds with a small island that is distant from the mainland?
A
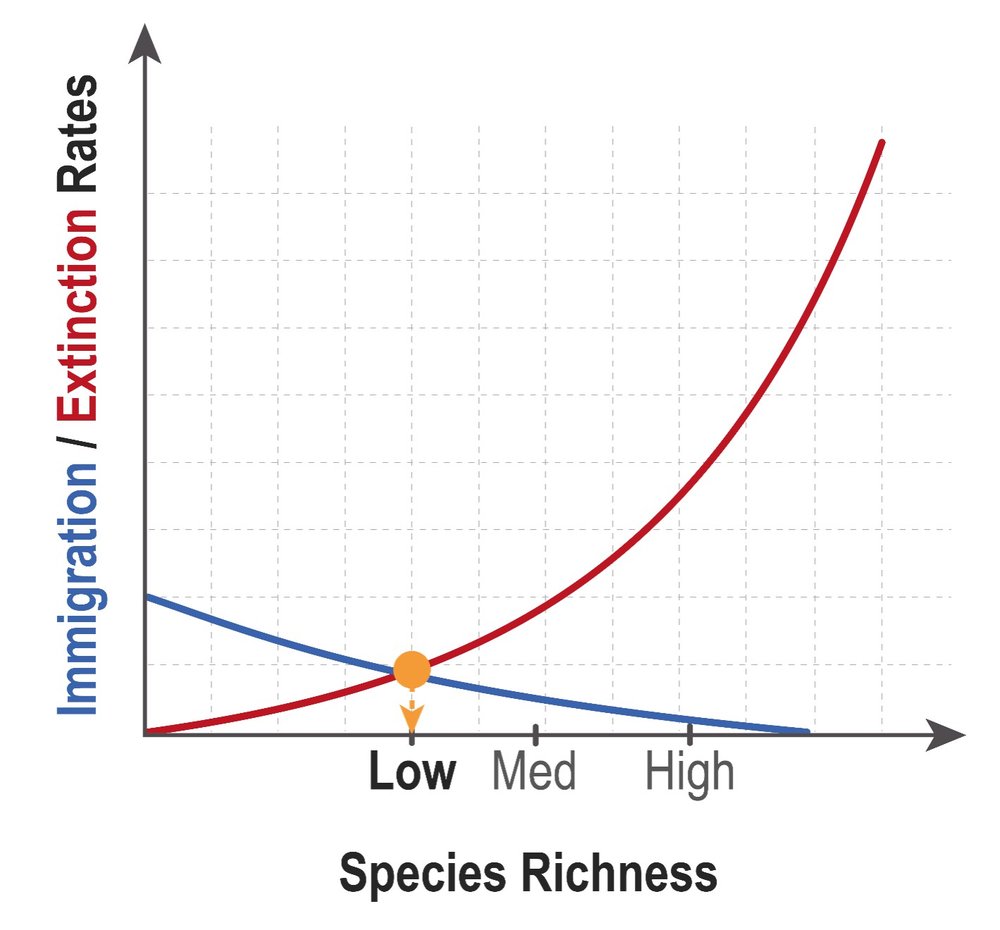
Graph #1
B
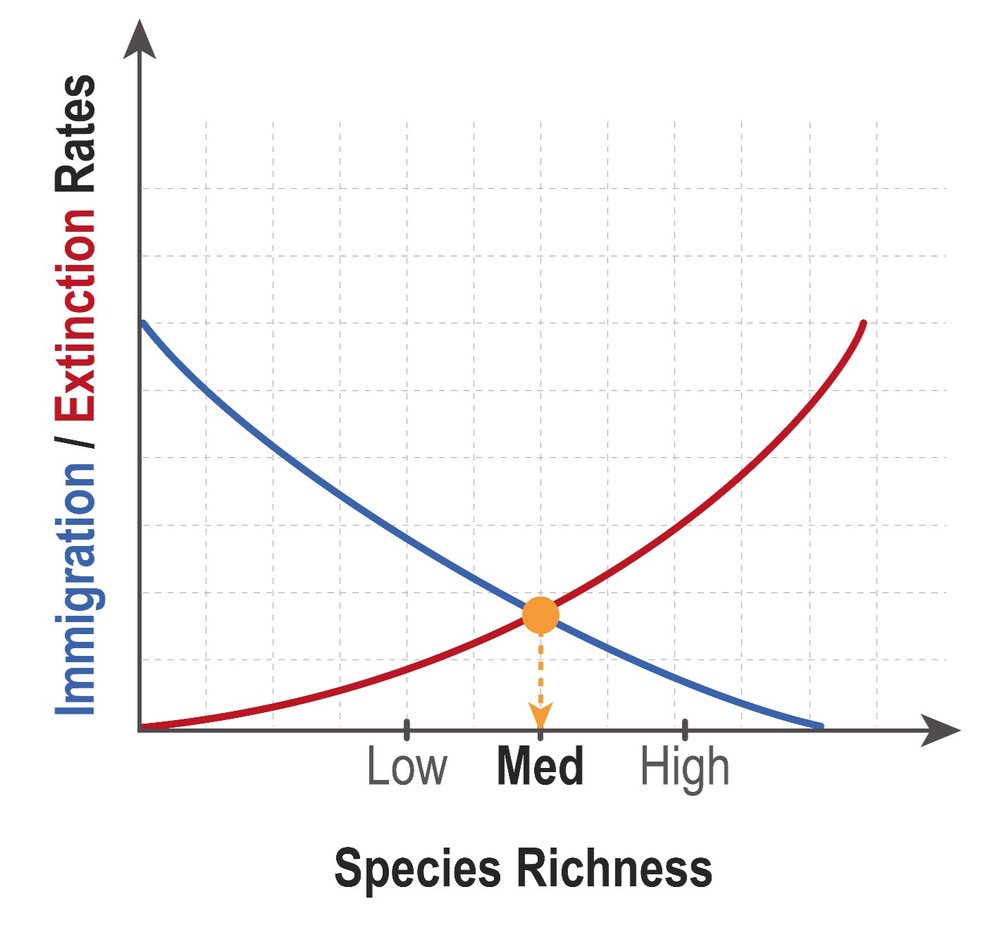
Graph #2
C
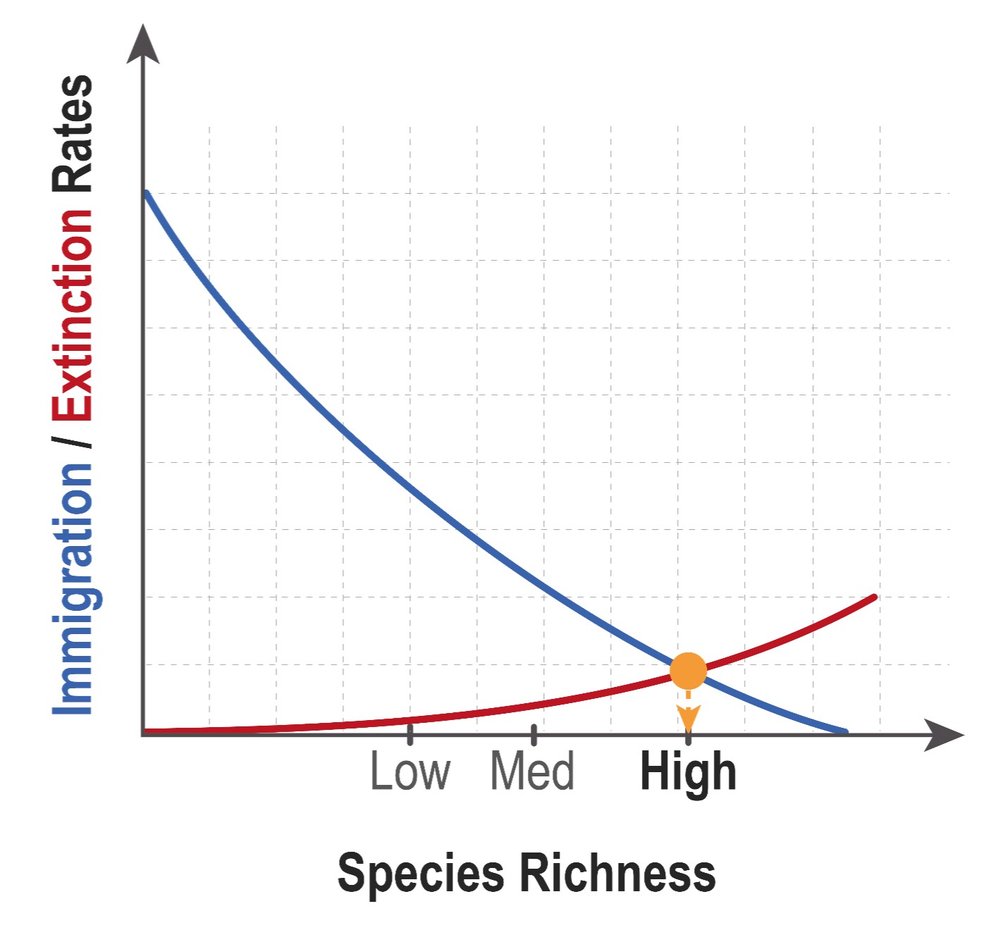
Graph #3
0 Comments
Verified step by step guidance
1
Understand the concept of island biogeography, which explains how species richness is affected by island size and distance from the mainland.
Recognize that a small island distant from the mainland will have low immigration rates due to its isolation.
Identify that such an island will also have high extinction rates because of limited resources and smaller population sizes.
Analyze the graphs: Graph #1 shows low immigration and high extinction rates at low species richness, which aligns with the characteristics of a small, distant island.
Conclude that Graph #1 best represents the scenario of a small island distant from the mainland, as it shows the expected low immigration and high extinction rates.


 Verified step by step guidance
