When wild plant and animal populations are logged, fished, or hunted, only the oldest or largest individuals tend to be taken. Many of the commercially important species are long lived and are slow to begin reproducing. If harvesting is not regulated carefully and exploitation is intense, what impact does harvesting have on a population's age structure? How might harvesting affect the population's life table and growth rate?
Table of contents
- 1. Introduction to Biology2h 42m
- 2. Chemistry3h 40m
- 3. Water1h 26m
- 4. Biomolecules2h 23m
- 5. Cell Components2h 26m
- 6. The Membrane2h 31m
- 7. Energy and Metabolism2h 0m
- 8. Respiration2h 40m
- 9. Photosynthesis2h 49m
- 10. Cell Signaling59m
- 11. Cell Division2h 47m
- 12. Meiosis2h 0m
- 13. Mendelian Genetics4h 44m
- Introduction to Mendel's Experiments7m
- Genotype vs. Phenotype17m
- Punnett Squares13m
- Mendel's Experiments26m
- Mendel's Laws18m
- Monohybrid Crosses19m
- Test Crosses14m
- Dihybrid Crosses20m
- Punnett Square Probability26m
- Incomplete Dominance vs. Codominance20m
- Epistasis7m
- Non-Mendelian Genetics12m
- Pedigrees6m
- Autosomal Inheritance21m
- Sex-Linked Inheritance43m
- X-Inactivation9m
- 14. DNA Synthesis2h 27m
- 15. Gene Expression3h 20m
- 16. Regulation of Expression3h 31m
- Introduction to Regulation of Gene Expression13m
- Prokaryotic Gene Regulation via Operons27m
- The Lac Operon21m
- Glucose's Impact on Lac Operon25m
- The Trp Operon20m
- Review of the Lac Operon & Trp Operon11m
- Introduction to Eukaryotic Gene Regulation9m
- Eukaryotic Chromatin Modifications16m
- Eukaryotic Transcriptional Control22m
- Eukaryotic Post-Transcriptional Regulation28m
- Eukaryotic Post-Translational Regulation13m
- 17. Viruses37m
- 18. Biotechnology2h 58m
- 19. Genomics17m
- 20. Development1h 5m
- 21. Evolution3h 1m
- 22. Evolution of Populations3h 53m
- 23. Speciation1h 37m
- 24. History of Life on Earth2h 6m
- 25. Phylogeny2h 31m
- 26. Prokaryotes4h 59m
- 27. Protists1h 12m
- 28. Plants1h 22m
- 29. Fungi36m
- 30. Overview of Animals34m
- 31. Invertebrates1h 2m
- 32. Vertebrates50m
- 33. Plant Anatomy1h 3m
- 34. Vascular Plant Transport1h 2m
- 35. Soil37m
- 36. Plant Reproduction47m
- 37. Plant Sensation and Response1h 9m
- 38. Animal Form and Function1h 19m
- 39. Digestive System1h 10m
- 40. Circulatory System1h 49m
- 41. Immune System1h 12m
- 42. Osmoregulation and Excretion50m
- 43. Endocrine System1h 4m
- 44. Animal Reproduction1h 2m
- 45. Nervous System1h 55m
- 46. Sensory Systems46m
- 47. Muscle Systems23m
- 48. Ecology3h 11m
- Introduction to Ecology20m
- Biogeography14m
- Earth's Climate Patterns50m
- Introduction to Terrestrial Biomes10m
- Terrestrial Biomes: Near Equator13m
- Terrestrial Biomes: Temperate Regions10m
- Terrestrial Biomes: Northern Regions15m
- Introduction to Aquatic Biomes27m
- Freshwater Aquatic Biomes14m
- Marine Aquatic Biomes13m
- 49. Animal Behavior28m
- 50. Population Ecology3h 41m
- Introduction to Population Ecology28m
- Population Sampling Methods23m
- Life History12m
- Population Demography17m
- Factors Limiting Population Growth14m
- Introduction to Population Growth Models22m
- Linear Population Growth6m
- Exponential Population Growth29m
- Logistic Population Growth32m
- r/K Selection10m
- The Human Population22m
- 51. Community Ecology2h 46m
- Introduction to Community Ecology2m
- Introduction to Community Interactions9m
- Community Interactions: Competition (-/-)38m
- Community Interactions: Exploitation (+/-)23m
- Community Interactions: Mutualism (+/+) & Commensalism (+/0)9m
- Community Structure35m
- Community Dynamics26m
- Geographic Impact on Communities21m
- 52. Ecosystems2h 36m
- 53. Conservation Biology24m
50. Population Ecology
Introduction to Population Ecology
Problem 11
Textbook Question
What is survivorship?
What does a survivorship curve show?
Explain what the three survivorship curves tell us about humans, squirrels, and clams.
 Verified step by step guidance
1
Survivorship refers to the proportion of individuals in a population that survive to a certain age. It is a key concept in population ecology and helps us understand patterns of survival and mortality within a species.
A survivorship curve is a graphical representation that shows the number or proportion of individuals surviving at each age for a given species or population. It helps visualize how survival rates change over the lifespan of organisms.
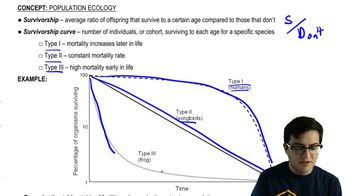
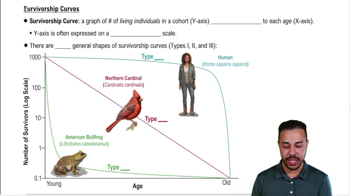
There are three main types of survivorship curves: Type I, Type II, and Type III. Each type reflects different survival strategies and life history traits.
Type I survivorship curve (e.g., humans): This curve is characterized by high survival rates during early and middle life, followed by a steep decline in survival in older age. It indicates that most individuals live to old age due to low mortality rates during youth and adulthood, often seen in species with parental care and fewer offspring.
Type II survivorship curve (e.g., squirrels): This curve shows a constant rate of mortality throughout the lifespan, meaning the likelihood of dying is roughly the same at any age. Type III survivorship curve (e.g., clams): This curve is marked by very high mortality rates early in life, with few individuals surviving to adulthood. Species with this curve often produce many offspring but provide little to no parental care.
 Verified video answer for a similar problem:
This video solution was recommended by our tutors as helpful for the problem above
Video duration:
2mPlay a video:
Was this helpful?
Key Concepts
Here are the essential concepts you must grasp in order to answer the question correctly.
Survivorship
Survivorship refers to the proportion of individuals in a population that survive to a certain age. It is a key concept in ecology and demography, helping to understand population dynamics and life history strategies. Survivorship can be influenced by various factors, including environmental conditions, predation, and reproductive strategies.
Recommended video:
Guided course

Survivorship
Survivorship Curves
Survivorship curves are graphical representations that illustrate the number of individuals surviving at each age for a given species. There are three main types of survivorship curves: Type I (high survival in early and middle life, with a steep decline in older age), Type II (constant mortality rate throughout life), and Type III (high mortality in early life, with survivors living longer). These curves provide insights into the reproductive strategies and life expectancy of different species.
Recommended video:
Guided course

Survivorship Curves
Comparative Analysis of Survivorship Curves
The analysis of different survivorship curves reveals important ecological and biological traits of species. For example, humans typically exhibit a Type I curve, indicating high survival rates in early life, while squirrels may show a Type II curve, reflecting a relatively constant mortality rate. Clams, on the other hand, often display a Type III curve, suggesting high mortality in early stages but potential longevity for those that survive. This comparative analysis helps in understanding the adaptive strategies of various organisms.
Recommended video:
Guided course

Survivorship Curves
Related Videos
Related Practice
Textbook Question
1066
views


