Textbook Question
Explain why mammals would not be able to produce concentrated urine if their nephrons lacked loops of Henle.
906
views

 Verified step by step guidanceVerified video answer for a similar problem:
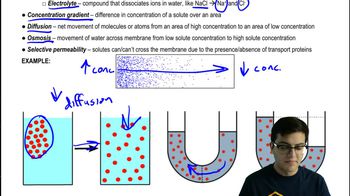
 07:59 07:59
 03:26
03:26 7:16m
7:16mMaster Osmoregulation and Nitrogenous Waste with a bite sized video explanation from Jason
Start learning