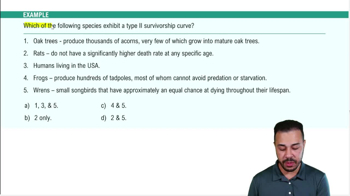
Population Demography quiz #2 Flashcards

Population Demography quiz #2
Control buttons has been changed to "navigation" mode.
1/17
  • Which of the following is best at showing the life expectancy of an individual within a population: life tables, birth rates, death rates, or migration patterns?

    Life tables are best at showing the life expectancy of an individual within a population as they summarize demographic data for cohorts, focusing on survivorship and mortality.
  • What is the primary focus of demography in population studies?

    Demography focuses on the statistical study of population characteristics, including size, structure, and distribution, influenced by birth rates, death rates, and migration.
  • What is a cohort in the context of life tables?

    A cohort is a group of same-species individuals born into a population around the same time, and they are all about the same age.
  • Why do life tables often only include data on females in sexually reproducing organisms?

    Life tables often include data on females because only females produce offspring, having a greater impact on population dynamics compared to males.
  • What does a type 1 survivorship curve indicate about mortality rates?

    A type 1 survivorship curve indicates low mortality rates early in life, with most individuals surviving to adulthood, followed by increased mortality rates later in life.
  • How is the y-axis of a survivorship curve typically expressed, and why?

    The y-axis of a survivorship curve is often expressed on a logarithmic scale to allow a wide range of values to be plotted on the same graph.
  • What characterizes a type 2 survivorship curve?

    A type 2 survivorship curve is characterized by constant mortality rates throughout the species' lifetime, creating a straight line on the graph.
  • What is the main difference between type 1 and type 3 survivorship curves?

    Type 1 survivorship curves have low early mortality rates, while type 3 curves have high early mortality rates, with most individuals not surviving to adulthood.
  • What is the significance of survivorship curves in population demography?

    Survivorship curves graphically represent life table data, illustrating the number of living individuals in a cohort surviving to each age group, helping analyze population dynamics.
  • What does a type 3 survivorship curve suggest about a species' early life stage?

    A type 3 survivorship curve suggests high mortality rates in the early life stage, with most individuals not surviving to adulthood.
  • What is demography and what key population characteristics does it study?

    Demography is the statistical study of population characteristics such as size, structure, and distribution, and it examines factors like birth rates, death rates, and migration.
  • Why do life tables for sexually reproducing species often focus on females?

    Life tables focus on females because only females produce offspring, so they have a greater impact on population dynamics.
  • What is survivorship in a life table, and how is it calculated?

    Survivorship is the proportion of the original cohort still alive at the start of a given age interval, calculated by dividing the number alive at that interval by the initial cohort size.
  • What is fecundity and how is it represented in a life table?

    Fecundity is the reproductive capacity, often shown as the average number of female offspring produced per female in each age interval.
  • Describe the characteristics of a type 1 survivorship curve and give an example organism.

    A type 1 survivorship curve shows low mortality early in life and high mortality in older age; humans are an example.
  • Explain the features of a type 3 survivorship curve and provide an example species.

    A type 3 survivorship curve has high early mortality with few individuals surviving to adulthood; the American bullfrog is an example.
  • How do birth rates, death rates, and migration collectively influence population demography?

    Birth rates increase population size, death rates decrease it, and migration can either add to or subtract from the population, all influencing demographic trends.