What is a life table and what demographic information does it typically include?
A life table is a statistical table that summarizes survivorship, mortality, and reproductive rates of a cohort, often focusing on females in sexually reproducing populations.
Define a cohort in the context of population demography.
A cohort is a group of individuals of the same species born around the same time and followed through their lives in demographic studies.
How is mortality rate determined in a life table?
Mortality rate is calculated by dividing the number of individuals that die during an age interval by the number alive at the start of that interval.
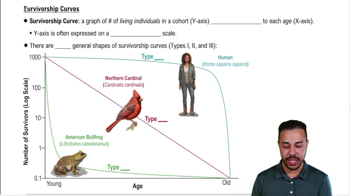
What is a survivorship curve and what does it graphically represent?
A survivorship curve is a graph that shows the number of individuals in a cohort surviving at each age, with age on the x-axis and number of survivors on the y-axis.
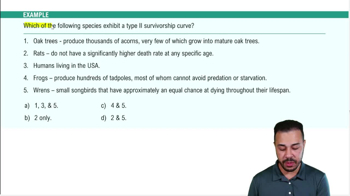
What defines a type 2 survivorship curve and which organism is a typical example?
A type 2 survivorship curve has a constant mortality rate throughout life; a typical example is the northern cardinal.
Why are survivorship curves considered a spectrum rather than strictly three types?
Most populations display survivorship patterns that fall between the classic type 1, 2, and 3 curves, making survivorship a spectrum.
What demographic information is typically included in a life table?
A life table typically includes survivorship, mortality rates, and reproductive rates of a cohort, often focusing on females in sexually reproducing populations.
In population demography, what is a cohort?
A cohort is a group of individuals of the same species born around the same time and followed through their lives in demographic studies.
How do you calculate the mortality rate for an age interval in a life table?
Mortality rate is calculated by dividing the number of individuals that die during an age interval by the number alive at the start of that interval.
What does a survivorship curve represent and how is it typically graphed?
A survivorship curve is a graph that shows the number of individuals in a cohort surviving at each age, with age on the x-axis and number of survivors on the y-axis, often using a logarithmic scale.
What is the term for the movement of individuals into a population?
The movement of individuals into a population is called immigration.
What are two ways a population can decrease in size?
A population can decrease in size through increased death rates and emigration (the movement of individuals out of a population).
What is the general formula for human population change?
The formula for human population change is: Population Change = (Births + Immigration) - (Deaths + Emigration).
Which situation can result in negative population growth?
Negative population growth occurs when the number of deaths and emigration exceeds the number of births and immigration.
How can histograms help describe a population in demography?
Histograms can help describe a population by visually representing the distribution of individuals across different age groups, allowing for analysis of population structure and trends.
What are the main factors that influence population size and structure in demography?
The main factors that influence population size and structure are birth rates, death rates, and migration (immigration and emigration).
 Back
Back

 03:49
03:49