What is an example of a density-independent factor that can affect the size of a human population?
Natural disasters
Which species is most likely to exhibit clumped dispersion? A) Wolves B) Birds C) Dandelions D) Humans
A) Wolves
What method involves counting the number of organisms in a specific area?
Quadrat sampling
What level of ecology is concerned with groups of individuals of the same species?
Population ecology
Which statement best describes population growth patterns in the world today? A) Exponential growth B) Logistic growth C) Declining growth D) Stable growth
A) Exponential growth
What is an example of a population?
All the humans in a city
What can you predict about a population with an age-structure diagram shaped like a pyramid?
The population is likely to experience rapid growth.
What is the term used for the pattern of spacing of a population within an area?
Dispersion
What condition would lead to a small population size?
High death rate
What are the three common patterns of population distribution?
Clumped, uniform, and random
What happens to the birth rate and death rate of a population at carrying capacity?
Birth rate equals death rate
What effect do competition and predation have on population size?
They can decrease population size by increasing mortality and reducing resources.
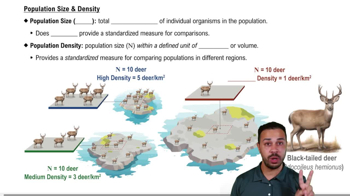
How does population distribution differ from population density?
Population distribution refers to the pattern of spacing among individuals, while population density is the number of individuals per unit area.
What best explains snowshoe hare–lynx population cycles?
Predator-prey interactions and resource availability
How do age-structure diagrams predict the growth of a population?
They show the distribution of various age groups, indicating potential for growth based on the proportion of young individuals.
How is a clumped population distribution beneficial for prey animals?
It provides safety in numbers, reducing individual predation risk.
What is an example of a species with high biotic potential?
Mice
What are the three types of survivorship curves?
Type I, Type II, and Type III
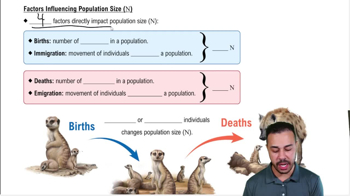
How would an ecologist calculate the future size of a population?
By using models that incorporate birth rates, death rates, immigration, and emigration.
What do age structure diagrams show about a population?
They show the distribution of age groups
How do humans impact the carrying capacity of a population?
Humans can increase carrying capacity through technology and resource management, but can also decrease it through overconsumption and environmental degradation.
What is an example of a population in an ecological context?
All the wolves in Yellowstone
What is a good example of a population?
All the humans in a city
Which change would cause an increase in the size of a population? A) Increased birth rate B) Increased death rate C) Increased emigration D) Decreased immigration
A) Increased birth rate
What factor contributes to clumped spacing patterns in populations?
Social behavior
How is a population defined in ecology?
A group of the same species in an area
Which is an example of a density-independent factor on a population? A) Disease B) Predation C) Natural disaster D) Competition
C) Natural disaster
What factor is most likely to contribute to density-dependent regulation of populations?
Predation
What does population distribution refer to?
The pattern of spacing among individuals within a population.
What are survivorship curves?
Graphs that show the number or proportion of individuals surviving at each age for a given species or group.
Which has a greater biotic potential- humans or mice? Why?
Mice have a greater biotic potential because they reproduce more quickly and have larger litters.
How many different trends do you see on a survivorship curve?
Three trends: Type I, Type II, and Type III
What do survivorship curves display?
They display the number or proportion of individuals surviving at each age for a given species or group.
What is an example of a Type III survivorship curve?
Frogs
What does this survivorship curve indicate about frogs?
Frogs have a high mortality rate early in life, with few individuals reaching adulthood.
What is the top-down hypothesis to explain the cyclic nature of snowshoe hare populations?
Predation by lynx and other predators controls hare population cycles.
What causes populations to compete?
Limited resources such as food, space, and mates.
What does a survivorship curve show?
It shows the number or proportion of individuals surviving at each age for a given species or group.
 Back
Back
 01:48
01:48