Table of contents
- 0. Functions(0)
- 1. Limits and Continuity(0)
- 2. Intro to Derivatives(0)
- 3. Techniques of Differentiation(0)
- 4. Derivatives of Exponential & Logarithmic Functions(0)
- 5. Applications of Derivatives(0)
- 6. Graphical Applications of Derivatives(0)
- 7. Antiderivatives & Indefinite Integrals(0)
- 8. Definite Integrals(0)
- 9. Graphical Applications of Integrals(0)
- 10. Integrals of Inverse, Exponential, & Logarithmic Functions(0)
- 11. Techniques of Integration(0)
- 12. Trigonometric Functions(0)
- Angles(0)
- Trigonometric Functions on Right Triangles(0)
- Solving Right Triangles(0)
- Trigonometric Functions on the Unit Circle(0)
- Graphs of Sine & Cosine(0)
- Graphs of Other Trigonometric Functions(0)
- Trigonometric Identities(0)
- Derivatives of Trig Functions(0)
- Integrals of Basic Trig Functions(0)
- Integrals of Other Trig Functions(0)
- 13: Intro to Differential Equations(0)
- 14. Sequences & Series(0)
- 15. Power Series(0)
- 16. Probability & Calculus(0)
8. Definite Integrals
Riemann Sums
8. Definite Integrals
Riemann Sums: Videos & Practice Problems
111 of 0
Problem 111Multiple Choice
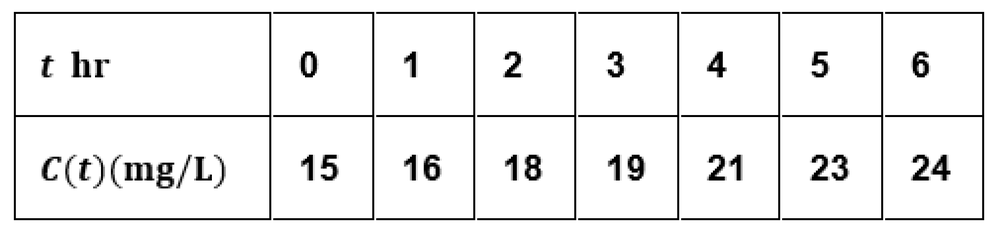
Environmental scientists measured the concentration of a certain pollutant (in ) in the Colorado River every hour during a -hour observation period. Assume the concentration values come from a continuous function , where is measured in hours since the start of the study. The average concentration over the -hour period is defined as . The data are shown in the table below:

Estimate the average pollutant concentration in the river over the -hour period using the Left Riemann sum. Provide the approximate value to two decimal places.
0 Comments