For which of the following scenarios can you NOT create a confidence interval using the standard normal or Student t-distribution?
Table of contents
- 1. Introduction to Statistics53m
- 2. Describing Data with Tables and Graphs2h 2m
- 3. Describing Data Numerically2h 8m
- 4. Probability2h 26m
- 5. Binomial Distribution & Discrete Random Variables3h 28m
- 6. Normal Distribution & Continuous Random Variables2h 21m
- 7. Sampling Distributions & Confidence Intervals: Mean3h 37m
- Sampling Distribution of the Sample Mean and Central Limit Theorem19m
- Distribution of Sample Mean - ExcelBonus23m
- Introduction to Confidence Intervals22m
- Confidence Intervals for Population Mean1h 26m
- Determining the Minimum Sample Size Required12m
- Finding Probabilities and T Critical Values - ExcelBonus28m
- Confidence Intervals for Population Means - ExcelBonus25m
- 8. Sampling Distributions & Confidence Intervals: Proportion2h 20m
- 9. Hypothesis Testing for One Sample5h 15m
- Steps in Hypothesis Testing1h 13m
- Performing Hypothesis Tests: Means1h 1m
- Hypothesis Testing: Means - ExcelBonus42m
- Performing Hypothesis Tests: Proportions39m
- Hypothesis Testing: Proportions - ExcelBonus27m
- Performing Hypothesis Tests: Variance12m
- Critical Values and Rejection Regions29m
- Link Between Confidence Intervals and Hypothesis Testing12m
- Type I & Type II Errors16m
- 10. Hypothesis Testing for Two Samples5h 35m
- Two Proportions1h 12m
- Two Proportions Hypothesis Test - ExcelBonus28m
- Two Means - Unknown, Unequal Variance1h 2m
- Two Means - Unknown Variances Hypothesis Test - ExcelBonus12m
- Two Means - Unknown, Equal Variance15m
- Two Means - Unknown, Equal Variances Hypothesis Test - ExcelBonus9m
- Two Means - Known Variance12m
- Two Means - Sigma Known Hypothesis Test - ExcelBonus21m
- Two Means - Matched Pairs (Dependent Samples)42m
- Matched Pairs Hypothesis Test - ExcelBonus12m
- Two Variances and F Distribution29m
- Two Variances - Graphing CalculatorBonus15m
- 11. Correlation1h 24m
- 12. Regression3h 42m
- Linear Regression & Least Squares Method26m
- Residuals12m
- Coefficient of Determination12m
- Regression Line Equation and Coefficient of Determination - ExcelBonus8m
- Finding Residuals and Creating Residual Plots - ExcelBonus11m
- Inferences for Slope32m
- Enabling Data Analysis ToolpakBonus1m
- Regression Readout of the Data Analysis Toolpak - ExcelBonus21m
- Prediction Intervals13m
- Prediction Intervals - ExcelBonus19m
- Multiple Regression - ExcelBonus29m
- Quadratic Regression23m
- Quadratic Regression - ExcelBonus10m
- 13. Chi-Square Tests & Goodness of Fit2h 31m
- 14. ANOVA2h 32m
7. Sampling Distributions & Confidence Intervals: Mean
Confidence Intervals for Population Mean
Multiple Choice
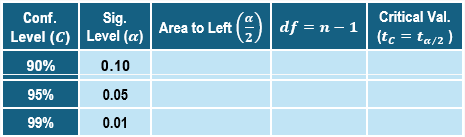
Fill out the table using a calculator and .

A
B
C
D
0 Comments
Verified step by step guidance1
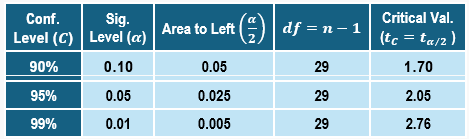
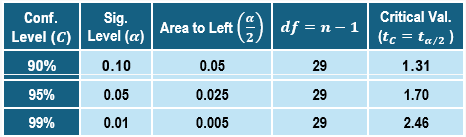
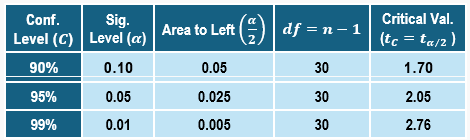
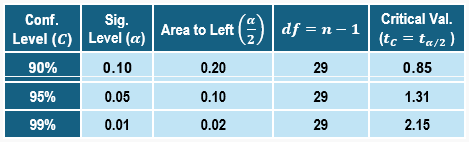
Step 1: Understand the table structure. The table includes columns for Confidence Level (C), Significance Level (α), Area to the Left (α/2), Degrees of Freedom (df = n - 1), and Critical Value (tC = tα/2).
Step 2: Identify the given sample size (n = 30). Calculate the degrees of freedom using the formula df = n - 1. For n = 30, df = 30 - 1 = 29.
Step 3: For each confidence level (90%, 95%, 99%), determine the significance level (α). For example, α = 1 - Confidence Level. For 90%, α = 0.10; for 95%, α = 0.05; for 99%, α = 0.01.
Step 4: Divide the significance level (α) by 2 to find the Area to the Left (α/2). For example, for α = 0.10, α/2 = 0.05; for α = 0.05, α/2 = 0.025; for α = 0.01, α/2 = 0.005.
Step 5: Use a t-distribution table or calculator to find the critical value (tC = tα/2) corresponding to the calculated degrees of freedom (df = 29) and the Area to the Left (α/2) for each confidence level. Fill in the table with these values.
Related Videos
Related Practice
Multiple Choice
134
views
1
rank

