- Download the worksheet to save time writing
- Start solving the practice problems
- If you're stuck, watch the video solutions
- See your summary to get more insights

A training specialist recorded the number of online learning modules completed by employees and their performance scores on a post-training assessment (out of ). The scatterplot below displays the relationship between these two variables. Based on the scatterplot, what kind of linear correlation exists between the number of modules completed and the assessment scores?
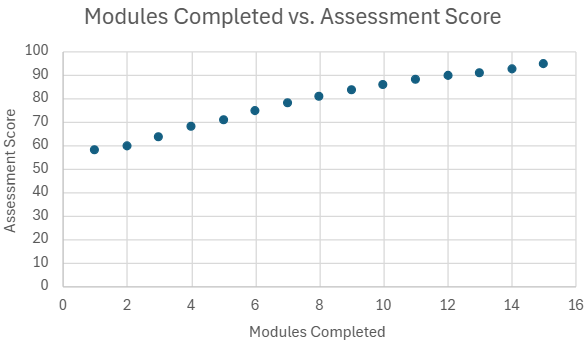
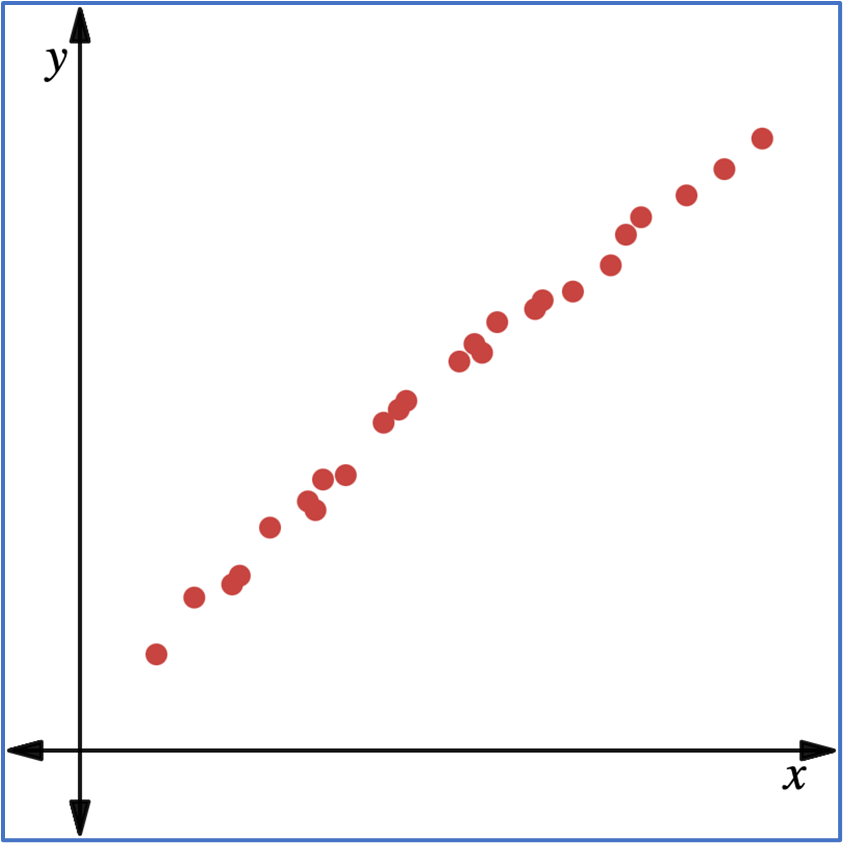
Determine the type of linear correlation between the variables shown in the scatter plot.
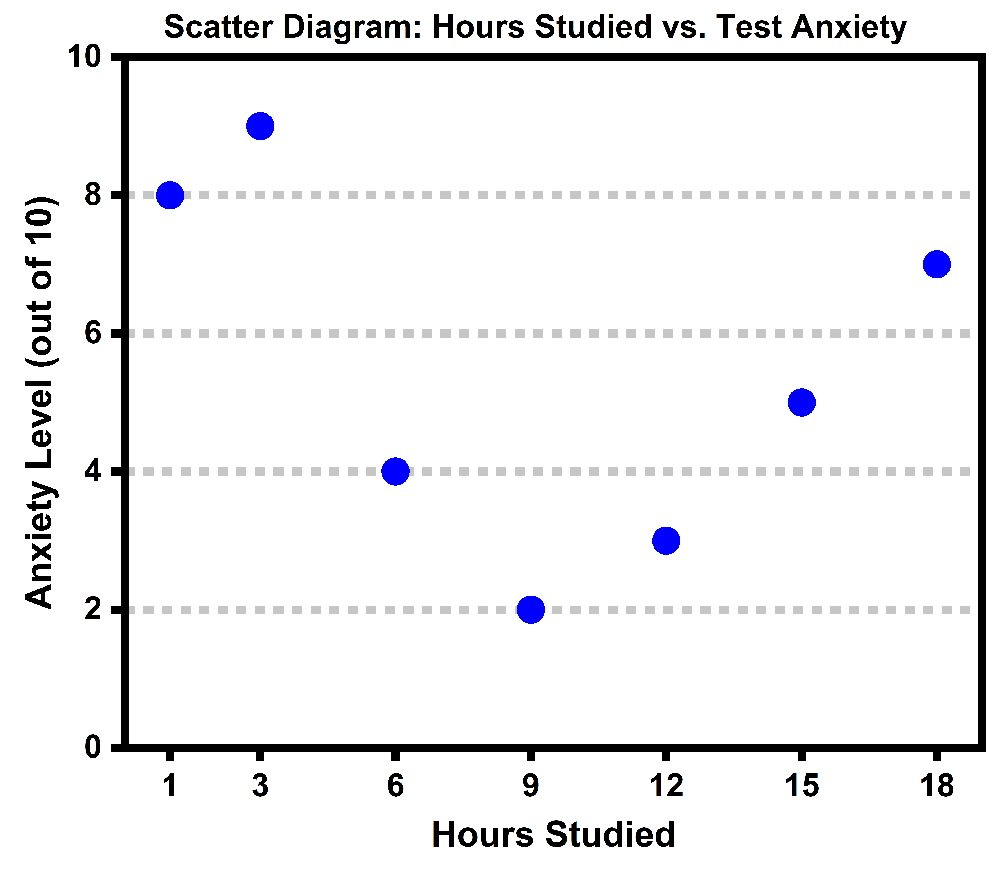
Based on the provided scatter diagram, what is wrong with the following statement: "Because the linear correlation coefficient between the number of hours studied and the self-reported anxiety level on a test day is , there is no relationship between study time and test anxiety."
A teacher is studying the relationship between the number of practice quizzes taken and final exam scores among students in a math class. The data for students is shown below:
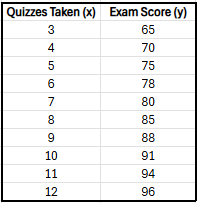
The correlation coefficient for this data is , indicating a strong positive linear relationship. The teacher then adds data for an student who took only quizzes but scored on the exam. How would this new data point likely affect the correlation coefficient ?
The correlation coefficient for this data is , showing a strong negative linear relationship: higher body fat percentage tends to be associated with fewer push-ups.
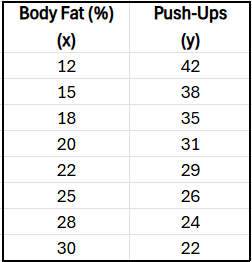
Suppose the trainer removes the data for the client with body fat and push-ups. How is the correlation coefficient likely to change?
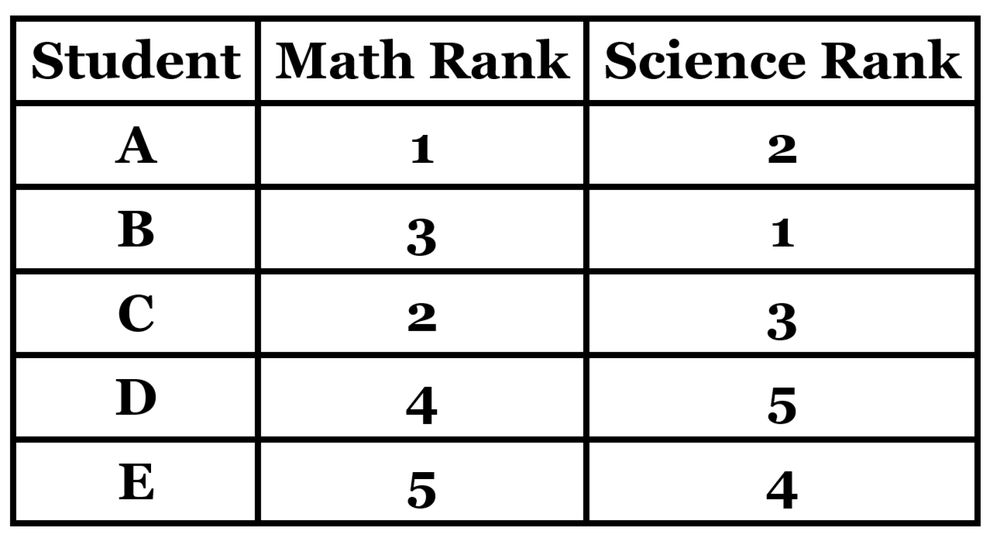
Use the ranks from the data provided below to calculate the Spearman rank correlation coefficient. Then, using a significance level, find the critical value and determine whether there is a statistically significant correlation between the two variables.