Statistics for Business
A company compares two bar graphs showing the number of projects completed by four departments in 2022 and 2023. In 2022: HR (8), IT (15), Marketing (12), Finance (10). In 2023: HR (10), IT (18), Marketing (9), Finance (14). Which department had the largest percentage increase in projects completed?
Given the following frequency table for favorite fruits among 20 students: Apple: 7, Banana: 5, Orange: 4, Grape: 4. How many bars should your bar graph have, and what should be the height of the tallest bar?
A company tracks the number of sales calls made by four employees in January and February. In January, Alice made 12, Bob 8, Carol 10, and Dan 6. In February, Alice made 9, Bob 11, Carol 7, and Dan 13. Who had the largest increase in sales calls from January to February?
A Pareto chart displays the number of customer complaints by type: Billing (30), Service (22), Product (15), Delivery (8), Other (5). Which two complaint types should management prioritize to address the majority of issues?
Why are bar graphs typically used to display categorical data rather than numerical data?
Which of the following is an example of categorical data suitable for a bar graph?
A bar graph shows the number of books read by four students: Sam (8), Lee (12), Pat (5), and Kim (10). How many more books did Lee read than Pat?
A bar graph shows that 15 students prefer tea, 9 prefer coffee, and 6 prefer juice. How many more students prefer tea than juice?
A Pareto chart of website issues shows: Slow Load (50), Broken Links (30), Poor Navigation (20), Outdated Content (10). If the company fixes only the top two issues, what percentage of total issues will be addressed?
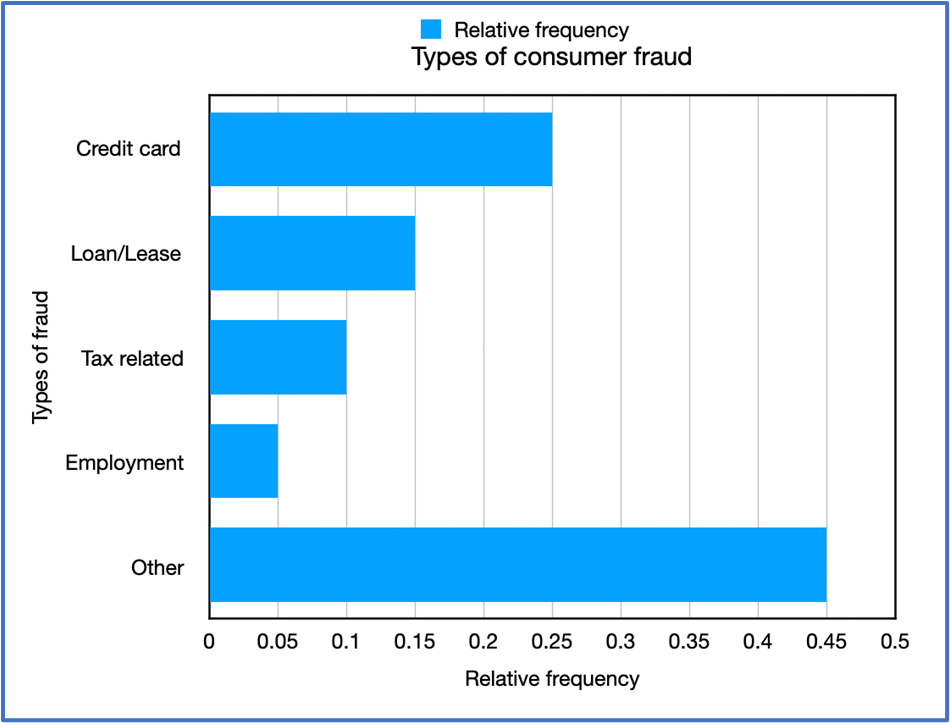
The following relative-frequency bar graph displays the types of consumer fraud reported in a survey. Approximately what percentage of fraud cases involved loan or lease fraud?