- Download the worksheet to save time writing
- Start solving the practice problems
- If you're stuck, watch the video solutions
- See your summary to get more insights

A group of students was asked about their favorite juice flavor. The results were categorized based on whether the student was in the morning class or the evening class.
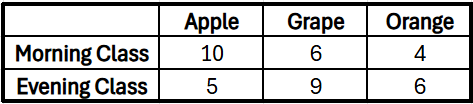
At a significance level, test the claim that juice flavor preference is independent of class time.
Consider the contingency table below. Compute the marginal frequencies for each row and column, and determine the expected frequency for each cell, assuming the variables are independent.
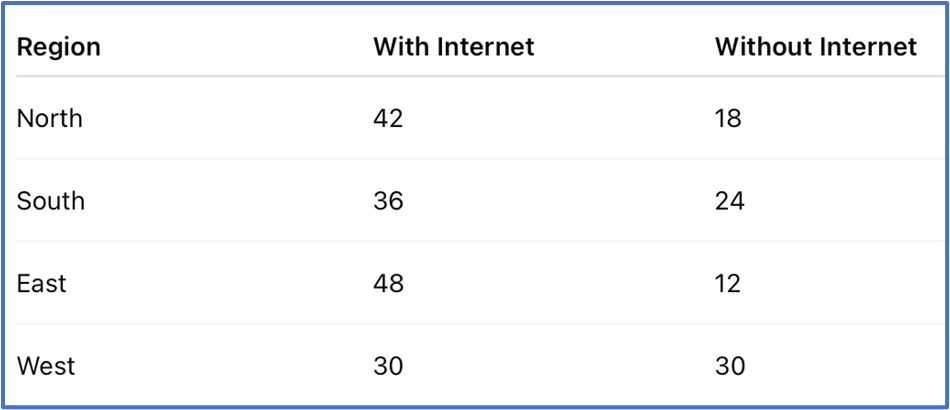
A survey summarizes the number of households (in hundreds) by region and internet access in a contingency table. Why is it inappropriate to use the independence test on this table?
A contingency table shows the number of adults (in units of thousands) in a city by employment status and level of education:
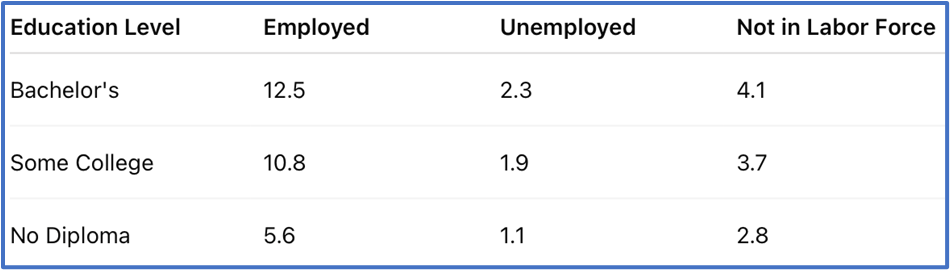
What percentage of adults (i) are employed and have some college, (ii) are unemployed, and (iii) have no diploma?
The following contingency table summarizes data for adults ages and over by education and employment status:
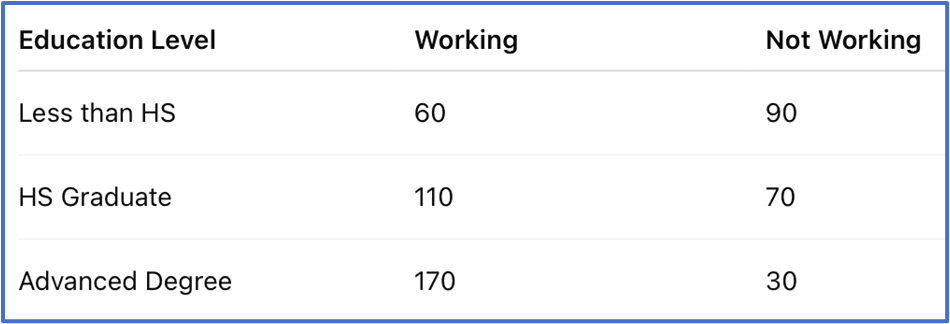
What percentage of these adults with an advanced degree are not working?
A survey of adults ages and over provides the following data:
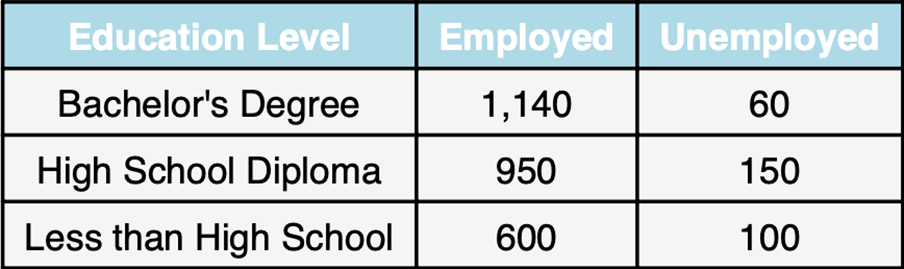
What percentage of these adults with a bachelor's degree are unemployed?
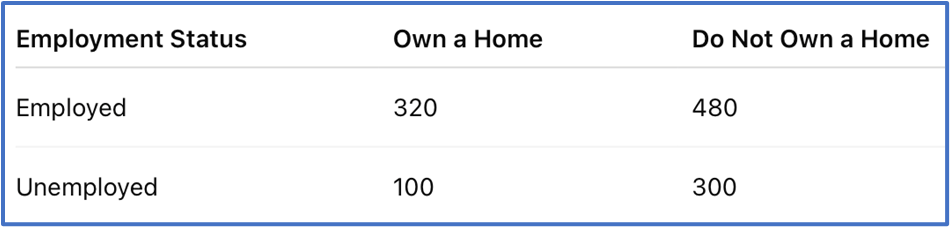
The following contingency table displays the results of a survey of adults in a city, which records their employment status and whether they own a home. What percent of employed adults own a home?