Frequency Distributions
- Download the worksheet to save time writing
- Start solving the practice problems
- If you're stuck, watch the video solutions
- See your summary to get more insights

Frequency Distributions
10 problems
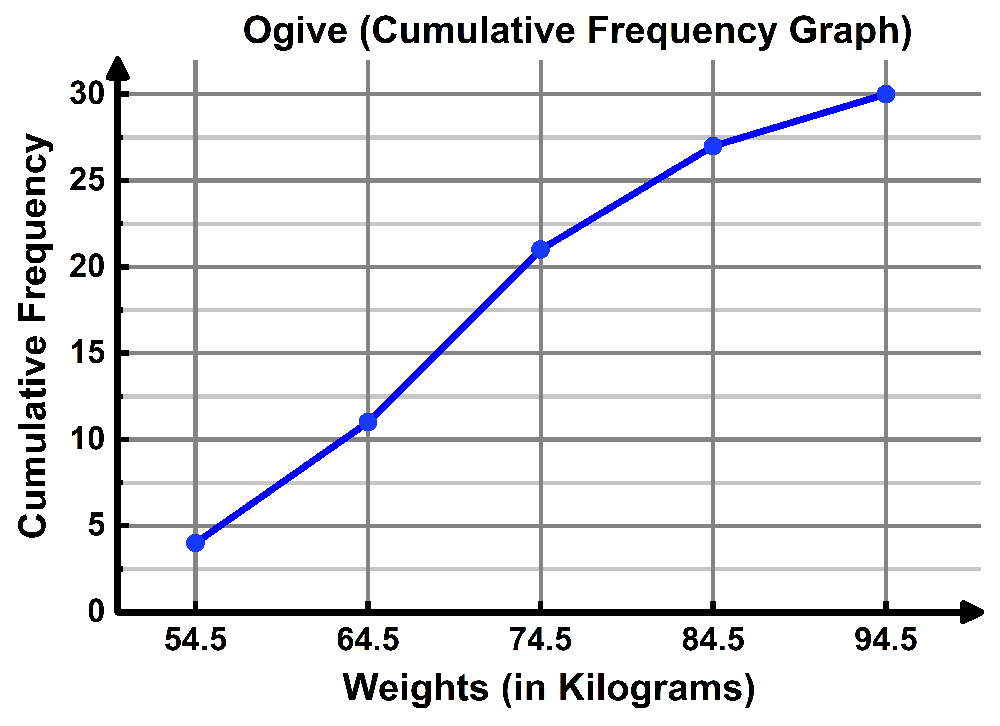
Problem 5Multiple Choice
A cumulative frequency ogive graph for the weights (in kilograms) of a group of students is given below. Use the graph to estimate the total number of students.
Problem 8Multiple Choice
A meteorology team recorded the wind speeds (in km/h) of storms over a period of time. The frequency distribution of wind speeds is given below.
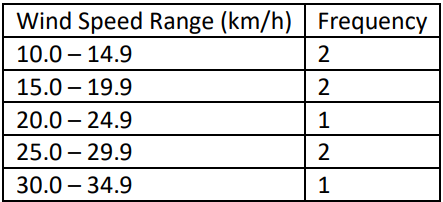
Using the frequency distribution above, find:
(i) The class limits of the first class
(ii) The class boundaries of the first class
(iii) The class midpoint of the first class