- Download the worksheet to save time writing
- Start solving the practice problems
- If you're stuck, watch the video solutions
- See your summary to get more insights

Survey: A research study assigned identification numbers from 1 to 500 to participants in a psychology experiment.
Which of the following best describes the level of measurement of the numbers 1, 2, 3, ..., 500 used in this study?
Which of the four levels of measurement best describes the given data?
Work Experience: In a corporate research study, the number of years employees have worked at a company is recorded for a randomly selected group of workers.
5.2% out of 28,500 college students surveyed said they exercise daily, according to data from the National Fitness Association.
Which of the following is the level of measurement of the value 5.2%?
A study of all the residents in a neighborhood found that own a bicycle. Is this a population parameter or a sample statistic? Justify your answer.
In an observational study, what distinguishes a confounding variable from a lurking variable?
Refer to the accompanying table of notebook batteries recorded at four different time intervals on five different days. These values represent the quality control measures used to ensure consistent battery weight.
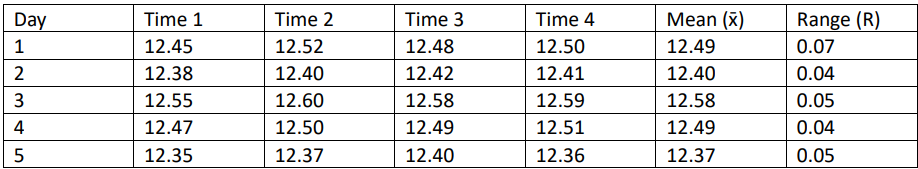
Compute the average sample mean (x̄̄) and the average range (R̅) using the data above. Find the control limits for the R-chart (LCLR and UCLR).
Determine whether the following statement is true or false. If it is false, rewrite it to make it true.
A parameter is a numerical description of a sample characteristic.
A survey of randomly selected restaurant owners found that believe offering vegetarian options improves customer satisfaction. Is this a population parameter or a sample statistic? Justify your answer.
A multiple regression model was developed to predict the fuel efficiency (miles per gallon, mpg) of cars based on three factors: engine size (liters), vehicle weight (kg), and horsepower. We get this multiple regression equation:
MPG = 45.6 − 3.12 × Engine Size − 0.015 × Weight + 0.032 × Horsepower
where:
MPG is the fuel efficiency (miles per gallon).
Engine Size is the engine displacement (liters).
Weight is the vehicle's weight (kg).
Horsepower is the engine's power output.
Identify the response and predictor variables.
A researcher recorded the number of hours students spent practicing a musical instrument and matched these values with their scores on a music proficiency test. If we find that the correlation coefficient r = 0, what does this indicate in above situation?