Scatterplots & Intro to Correlation
- Download the worksheet to save time writing
- Start solving the practice problems
- If you're stuck, watch the video solutions
- See your summary to get more insights

Scatterplots & Intro to Correlation
10 problems
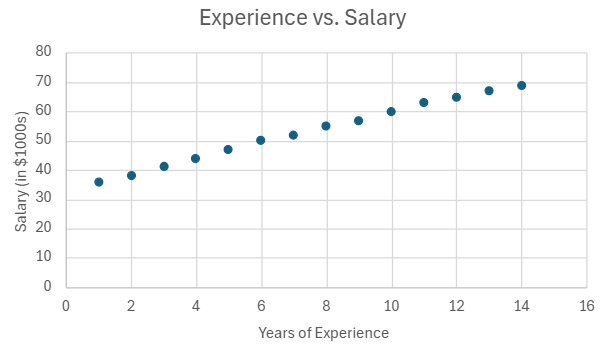
Problem 6Multiple Choice
A company collected data on customer service agents, recording their years of experience and their annual salaries (in thousands of dollars). The scatterplot below shows the relationship between experience and salary. Based on the scatterplot, what type of correlation, if any, is suggested by the data?
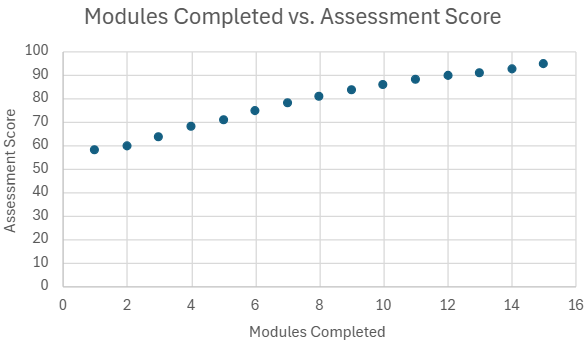
Problem 9Multiple Choice
A training specialist recorded the number of online learning modules completed by employees and their performance scores on a post-training assessment (out of ). The scatterplot below displays the relationship between these two variables. Based on the scatterplot, what kind of linear correlation exists between the number of modules completed and the assessment scores?