What is the purpose of using a TI-84 calculator for larger datasets in statistics?
The TI-84 calculator helps efficiently compute statistical values like the five-number summary for large datasets, saving time compared to manual calculations.
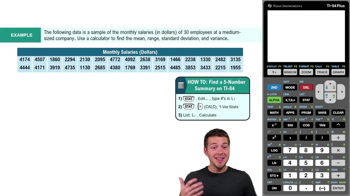
What are the five numbers included in the five-number summary on a TI-84?
The five-number summary includes the mean, median, standard deviation, first quartile (Q1), and third quartile (Q3).
Which button do you press first to begin entering data into the TI-84 calculator?
You press the 'stat' button to access the data entry functions on the TI-84.
How do you clear an existing list in the TI-84 before entering new data?
Press 'stat', select 'clear list', type in the list name (e.g., L1), and hit 'done' to clear the list.
What is the next step after entering all your data into the TI-84 calculator?
After entering data, you exit the edit screen and access the 'one-variable statistics' function to analyze the data.
Which function on the TI-84 provides the five-number summary?
The '1-Var Stats' function on the TI-84 provides the five-number summary.
What does the mean (x̄) represent in your dataset?
The mean (x̄) represents the average value of all data points in the dataset.
How does the TI-84 display standard deviation, and which value should you use for a sample?
The TI-84 displays both s x (sample standard deviation) and σ x (population standard deviation); use s x for sample data.
What is the significance of the first quartile (Q1) in a dataset?
Q1 is the value below which 25% of the data points fall, indicating the lower quarter of the distribution.
What does the third quartile (Q3) indicate about your data?
Q3 is the value below which 75% of the data points fall, marking the upper quarter of the distribution.
How is the median displayed in the TI-84's one-variable statistics output?
The median is shown as the middle value of the dataset in the one-variable statistics output.
What information does the TI-84 provide besides the five-number summary?
The TI-84 also provides the minimum, maximum, and the number of data points in the dataset.
Why is it important to distinguish between sample and population standard deviation on the TI-84?
It's important because statistical analysis often requires the correct standard deviation based on whether the data is a sample or a population.
What does the 'frequency list' option mean when running 1-Var Stats, and when should you use it?
The frequency list is used if data points have frequencies; for simple lists, leave it blank.
How can the five-number summary help in making informed decisions about a dataset?
The five-number summary provides key insights into data distribution, variability, and central tendency, aiding in statistical analysis and decision-making.
 Back
Back


 04:51
04:51