Skip to main content
Statistics for Business
My Course
Learn
Exam Prep
AI Tutor
Study Guides
Flashcards
Explore
Try the app
My Course
Learn
Exam Prep
AI Tutor
Study Guides
Flashcards
Explore
Try the app
Back
Confidence Intervals for Population Proportion - Excel definitions
You can tap to flip the card.
Confidence Interval
You can tap to flip the card.
👆
Confidence Interval
A range of values likely to contain the true proportion, calculated using sample data and margin of error.
Track progress
Control buttons has been changed to "navigation" mode.
1/15
Related flashcards
Related practice
Recommended videos
Confidence Intervals for Population Proportion - Excel quiz
Confidence Intervals for Population Proportion - Excel
15 Terms
8. Sampling Distributions & Confidence Intervals: Proportion
2 topics
15 problems
Chapter
Laura
Guided course
06:57
Confidence Intervals for Population Prortion - Excel
89
views
1
rank
Guided course
05:49
Confidence Intervals for Population Prortion - Excel Example 1
68
views
3
rank
Terms in this set (15)
Hide definitions
Confidence Interval
A range of values likely to contain the true proportion, calculated using sample data and margin of error.
Population Proportion
The actual fraction of a group with a certain characteristic, estimated using sample results.
Sample Proportion
A value found by dividing the number of successes in a sample by the total sample size.
Margin of Error
The amount added and subtracted from the sample proportion to create the confidence interval bounds.
Critical Value
A number from the standard Normal distribution used to determine the margin of error for a given confidence level.
Z-Score
A value indicating how many standard deviations a point is from the mean, used in confidence interval calculations.
Alpha
The probability of error, found by subtracting the confidence level from one.
Confidence Level
The probability that the calculated interval contains the true population proportion.
Sample Size
The total number of observations or individuals included in the sample.
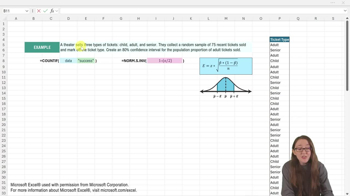
COUNTIF
An Excel function that counts how many times a specified value appears in a dataset.
NORM.S.INV
An Excel function that returns the z-score for a given left-tail probability in the standard Normal distribution.
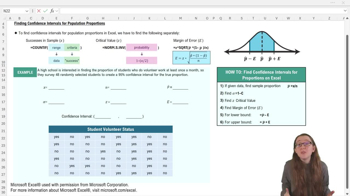
Lower Bound
The smallest value in the confidence interval, found by subtracting the margin of error from the sample proportion.
Upper Bound
The largest value in the confidence interval, found by adding the margin of error to the sample proportion.
Statistical Inference
The process of drawing conclusions about a population based on sample data.
Sampling Variability
The natural fluctuation in sample statistics from one sample to another.
 BackBack
 06:57
06:57