Skip to main content
Statistics for Business
My Course
Learn
Exam Prep
AI Tutor
Study Guides
Flashcards
Explore
Try the app
My Course
Learn
Exam Prep
AI Tutor
Study Guides
Flashcards
Explore
Try the app
Back
Goodness of Fit Test definitions
You can tap to flip the card.
Goodness of Fit Test
You can tap to flip the card.
👆
Goodness of Fit Test
Statistical procedure for assessing if observed category frequencies align with those predicted by a specific distribution.
Track progress
Control buttons has been changed to "navigation" mode.
1/15
Related flashcards
Related practice
Recommended videos
Goodness of Fit Test quiz
Goodness of Fit Test
15 Terms
Goodness of Fit Test
13. Chi-Square Tests & Goodness of Fit
10 problems
Topic
Brendan
13. Chi-Square Tests & Goodness of Fit
3 topics
15 problems
Chapter
Brendan
Guided course
10:17
Goodness of Fit Test
194
views
4
rank
Guided course
05:24
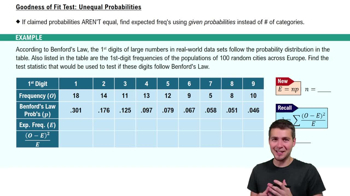
Goodness of Fit Test: Unequal Probabilities
108
views
Guided course
08:22
Goodness of Fit Test: Unequal Probabilities Example 2
108
views
Terms in this set (15)
Hide definitions
Goodness of Fit Test
Statistical procedure for assessing if observed category frequencies align with those predicted by a specific distribution.
Observed Frequency
Actual count of occurrences in each category collected from sample data.
Expected Frequency
Theoretical count for each category, calculated based on the claimed probability distribution.
Null Hypothesis
Assumption that observed frequencies match those predicted by the claimed distribution.
Alternative Hypothesis
Statement that at least one observed frequency differs from the expected frequency.
Chi-Squared Statistic
Sum of squared differences between observed and expected frequencies, divided by expected frequencies.
Degrees of Freedom
Value found by subtracting one from the number of categories, used in interpreting the test statistic.
P-Value
Probability of obtaining a test statistic as extreme as, or more extreme than, the observed value under the null hypothesis.
Significance Level
Threshold probability, often denoted alpha, used to decide whether to reject the null hypothesis.
Uniform Distribution
Probability model where all categories are equally likely, leading to equal expected frequencies.
Critical Value
Cutoff point from the chi-squared distribution used to determine statistical significance.
Random Sample
Data collection method ensuring each member of the population has an equal chance of selection.
Category
Distinct group or outcome for which frequencies are counted in the analysis.
Sample Size
Total number of observations or trials included in the dataset.
Benford's Law
Empirical rule stating that in many datasets, lower digits appear as leading digits more frequently than higher digits.
 BackBack

 10:17
10:17