A goodness of fit test determines if observed frequencies match expected frequencies based on a claimed distribution.
How are observed frequencies defined in a goodness of fit test?
Observed frequencies are the actual counts seen in the data for each category.
What does the null hypothesis state in a goodness of fit test?
The null hypothesis states that observed frequencies match the claimed distribution.
What is the alternative hypothesis in a goodness of fit test?
The alternative hypothesis states that at least one observed frequency does not match the claimed distribution.
What test statistic is used in a goodness of fit test?
The chi-squared statistic is used, calculated as Σ(O-E)^2/E.
How do you calculate expected frequencies when probabilities are equal?
Expected frequencies are calculated as the sample size divided by the number of categories (E = n/k).
How do you calculate expected frequencies when probabilities are unequal?
Expected frequencies are calculated by multiplying the sample size by the probability for each category (E = n × p).
What is the formula for degrees of freedom in a goodness of fit test?
Degrees of freedom are calculated as the number of categories minus one (df = k - 1).
How is the p-value interpreted in a goodness of fit test?
A low p-value indicates the observed data is unusual under the claimed distribution, suggesting a poor fit.
What happens if the p-value is less than the significance level (alpha)?
If the p-value is less than alpha, you reject the null hypothesis and conclude the observed frequencies do not fit the claimed distribution.
What are the conditions that must be met to use a goodness of fit test?
You need random samples, observed frequencies for all categories, and expected values of at least 5 for each category.
What does a high chi-squared value indicate about the data?
A high chi-squared value indicates a large discrepancy between observed and expected frequencies.
How do you calculate the chi-squared statistic for each category?
For each category, subtract the expected frequency from the observed, square the result, and divide by the expected frequency.
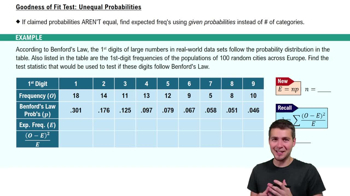
What is Benford's Law and how does it relate to goodness of fit tests?
Benford's Law describes a non-uniform distribution of digits in real-world data, and goodness of fit tests can check if observed data follows this law.
What is the final step in a goodness of fit test after calculating the chi-squared statistic?
The final step is to compare the p-value to the significance level and make a conclusion about the fit between observed and expected frequencies.
 Back
Back

 10:17
10:17