Skip to main content
Statistics for Business
My Course
Learn
Exam Prep
AI Tutor
Study Guides
Flashcards
Explore
Try the app
My Course
Learn
Exam Prep
AI Tutor
Study Guides
Flashcards
Explore
Try the app
Back
Matched Pairs Hypothesis Test - Excel definitions
You can tap to flip the card.
Pooled t Test
You can tap to flip the card.
👆
Pooled t Test
Statistical method comparing two means when population variances are unknown but assumed equal, often used in experimental design.
Track progress
Control buttons has been changed to "navigation" mode.
1/15
Related flashcards
Related practice
Recommended videos
Matched Pairs Hypothesis Test - Excel quiz
Matched Pairs Hypothesis Test - Excel
15 Terms
10. Hypothesis Testing for Two Samples
3 topics
15 problems
Chapter
Ally
Guided course
04:03
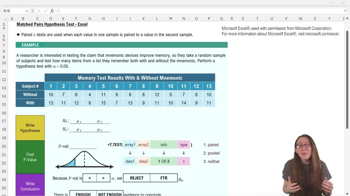
Matched Pairs Hypothesis Test - Excel
53
views
1
rank
Guided course
03:51
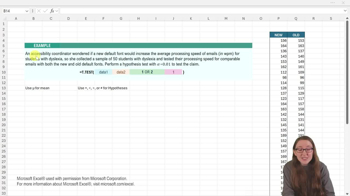
Matched Pairs Hypothesis Test - Excel Example 1
50
views
1
rank
Guided course
04:22
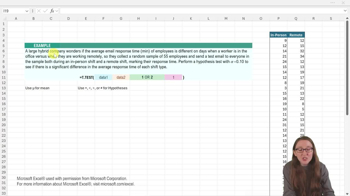
Matched Pairs Hypothesis Test - Excel Example 2
58
views
1
rank
Terms in this set (15)
Hide definitions
Pooled t Test
Statistical method comparing two means when population variances are unknown but assumed equal, often used in experimental design.
Null Hypothesis
Statement asserting no difference exists between two population means, serving as the default assumption in testing.
Alternative Hypothesis
Claim suggesting a difference exists between two population means, tested against the null hypothesis.
Population Mean
Average value of a variable for an entire group, often represented by the Greek letter mu (μ).
Population Variance
Measure of how data points in a population are spread out, assumed equal in pooled t tests.
Alpha Level
Threshold probability, such as 0.05, used to determine statistical significance in hypothesis testing.
p Value
Probability of observing results as extreme as those measured, assuming the null hypothesis is true.
Two-Tailed Test
Statistical test evaluating for any difference between means, regardless of direction.
T.TEST Function
Excel tool for calculating the probability value when comparing two sample means under various test types.
Random Sample
Subset of data selected from a population where each member has an equal chance of selection.
Significance Level
Predefined cutoff, often 0.05, for deciding whether to reject the null hypothesis.
Experimental Design
Structured approach to collecting and analyzing data to test hypotheses in a controlled manner.
Sample Data
Observed values collected from a subset of a population, used to estimate population parameters.
Equality of Variances
Assumption that two populations have the same variance, required for pooled t tests.
Hypothesis Test
Procedure for making inferences about population parameters based on sample statistics.
 BackBack
 04:03
04:03