Skip to main content
Statistics for Business
My Course
Learn
Exam Prep
AI Tutor
Study Guides
Flashcards
Explore
Try the app
My Course
Learn
Exam Prep
AI Tutor
Study Guides
Flashcards
Explore
Try the app
Back
Quadratic Regression definitions
You can tap to flip the card.
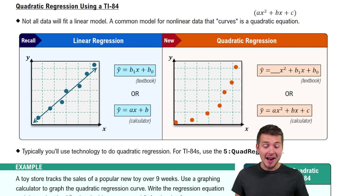
Quadratic Regression
You can tap to flip the card.
👆
Quadratic Regression
A statistical method modeling data with a curved equation, ideal for nonlinear trends resembling a U or inverted U shape.
Track progress
Control buttons has been changed to "navigation" mode.
1/15
Related flashcards
Related practice
Recommended videos
Quadratic Regression quiz
Quadratic Regression
15 Terms
12. Regression
4 topics
15 problems
Chapter
Ally
Guided course
07:48
Quadratic Regression Using TI-84 Example 1
73
views
Guided course
07:11
Quadratic Regression Using TI-84
150
views
Terms in this set (15)
Hide definitions
Quadratic Regression
A statistical method modeling data with a curved equation, ideal for nonlinear trends resembling a U or inverted U shape.
Quadratic Equation
A mathematical expression in the form ax² + bx + c, where the squared term introduces curvature to the graph.
Coefficient of Determination
A value, often called R², indicating how well a model fits data; values near 1 show a strong fit.
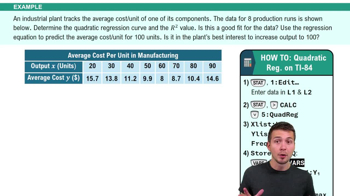
Graphing Calculator
A handheld device, such as the TI-84, used to input data, perform regression analysis, and graph equations.
Best Fit Curve
A curve that most closely follows the pattern of data points, minimizing the overall distance from each point.
Nonlinear Data
A dataset where the relationship between variables forms a curve rather than a straight line.
Stat Menu
A calculator feature allowing users to enter, edit, and analyze statistical data for regression calculations.
Y1
A calculator variable where regression equations are stored for easy graphing and visualization.
R Squared Value
A numerical measure showing how closely the regression curve matches the actual data points.
Predictive Analytics
The practice of using statistical models to forecast future outcomes based on current or historical data.
Regression Analysis
A statistical approach for estimating relationships among variables, often used for prediction and modeling.
Stat Plot
A calculator function that displays data points on a graph, aiding in visualizing regression results.
Window Settings
Graphing calculator parameters that define the visible range for x and y axes, ensuring all data is displayed.
Curvature
The degree to which a graph bends, determined by the coefficient of the squared term in a quadratic equation.
Data Mining
The process of analyzing large datasets to discover patterns, often using regression techniques for insights.
 BackBack
 07:48
07:48