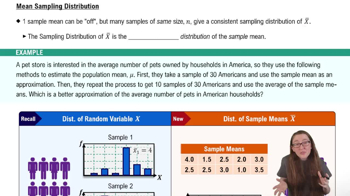
What is the sampling distribution of the sample mean?
It is the frequency distribution of sample means from many samples of the same size taken from a population.
Why is a single sample mean not always a reliable estimate of the population mean?
A single sample may not be representative, leading to sampling error and potentially inaccurate estimates.
How does taking multiple samples improve the estimate of the population mean?
Averaging multiple sample means reduces the effect of outliers and provides a more reliable estimate.
What shape does the sampling distribution of the sample mean tend to have as sample size increases?
It becomes approximately normal, forming a bell curve centered at the population mean.
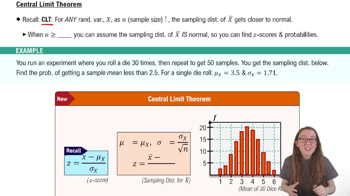
What does the Central Limit Theorem state about the sampling distribution of the sample mean?
It states that as sample size increases, the sampling distribution of the sample mean approaches a normal distribution, regardless of the population's distribution.
At what sample size can we generally apply the Central Limit Theorem?
When the sample size n is greater than or equal to 30.
How do you calculate the standard deviation of the sampling distribution of the sample mean?
Divide the population standard deviation by the square root of the sample size: σ/√n.
Why is the standard deviation of the sampling distribution smaller than the population standard deviation?
Because it measures variation between sample means, not individual values, and increases in sample size reduce this variation.
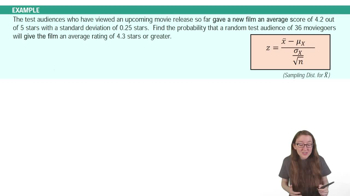
What is the formula for the z-score of a sample mean in a sampling distribution?
Z = (x̄ - μ) / (σ/√n), where x̄ is the sample mean, μ is the population mean, σ is the population standard deviation, and n is the sample size.
Why is the sampling distribution a better predictor of the population mean than a single sample?
Because averaging multiple sample means cancels out extreme values and provides a value closer to the actual population mean.
What happens to the shape of the sampling distribution as the sample size increases?
It becomes more tightly clustered around the population mean and more closely resembles a normal distribution.
How can we use the normal distribution to answer questions about the sampling distribution when n ≥ 30?
We can calculate z-scores and use z tables or technology to find probabilities for sample means.
What does a small probability for a sample mean indicate in the context of the sampling distribution?
It means that obtaining such a sample mean is unlikely if the population mean is as expected.
What is the mean of the sampling distribution of the sample mean?
It is equal to the population mean.
How does increasing the sample size affect the standard deviation of the sampling distribution?
It decreases the standard deviation, making sample means more consistent and closer to the population mean.
 Back
Back

 02:33
02:33