Skip to main content
Statistics for Business
My Course
Learn
Exam Prep
AI Tutor
Study Guides
Flashcards
Explore
Try the app
My Course
Learn
Exam Prep
AI Tutor
Study Guides
Flashcards
Explore
Try the app
Back
Two Means - Unknown, Equal Variance definitions
You can tap to flip the card.
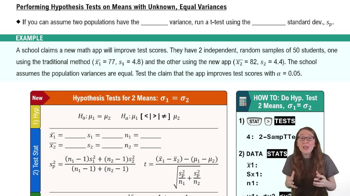
Pooled Standard Deviation
You can tap to flip the card.
👆
Pooled Standard Deviation
A weighted average of two sample variances, used to estimate a common population standard deviation when variances are assumed equal.
Track progress
Control buttons has been changed to "navigation" mode.
1/15
Related flashcards
Related practice
Recommended videos
Two Means - Unknown, Equal Variance quiz
Two Means - Unknown, Equal Variance
15 Terms
10. Hypothesis Testing for Two Samples
3 topics
15 problems
Chapter
Ally
Guided course
06:20
Means Unknown Equal Variances Hypothesis Test Using TI-84
117
views
Guided course
03:10
Means Unknown Equal Variances Hypothesis Test Using TI-84 Example 1
64
views
Guided course
03:34
Means Unknown Equal Variances Hypothesis Test Using TI-84 Example 2
66
views
Terms in this set (15)
Hide definitions
Pooled Standard Deviation
A weighted average of two sample variances, used to estimate a common population standard deviation when variances are assumed equal.
Equal Variance Assumption
The premise that two populations have the same variance, allowing for more precise statistical testing using pooled data.
Hypothesis Test
A structured process for deciding if sample data provides enough evidence to support a specific claim about population parameters.
Null Hypothesis
A statement asserting no difference or effect, typically that two population means are equal.
Alternative Hypothesis
A claim suggesting a difference or effect exists, such as one mean being greater than the other.
Test Statistic
A calculated value, often a t-score, used to determine how far sample results deviate from the null hypothesis.
P-value
The probability of observing results as extreme as those in the sample, assuming the null hypothesis is true.
Alpha Level
A threshold probability, often 0.05, used to decide whether to reject the null hypothesis.
Degrees of Freedom
A value based on sample sizes, used to select the correct distribution for hypothesis testing.
Independent Samples
Groups selected so that the outcome of one does not influence the outcome of the other.
Sample Mean
The average value calculated from a group, representing the central tendency of the sample.
Sample Standard Deviation
A measure of variability within a sample, indicating how spread out the data points are.
T-table
A reference chart used to find probabilities and critical values for t-distributions based on degrees of freedom.
Normal Approximation
An approach where large sample sizes allow the use of normal distribution properties for inference.
A/B Test
A comparison of two groups to determine if a change or treatment leads to a statistically significant difference.
 BackBack
 06:20
06:20