Skip to main content
Statistics for Business
My Course
Learn
Exam Prep
AI Tutor
Study Guides
Flashcards
Explore
Try the app
My Course
Learn
Exam Prep
AI Tutor
Study Guides
Flashcards
Explore
Try the app
Back
Two Proportions quiz
You can tap to flip the card.
What is the null hypothesis (H0) when testing two population proportions?
You can tap to flip the card.
👆
What is the null hypothesis (H0) when testing two population proportions?
The null hypothesis is that the two proportions are equal, or p1 = p2.
Track progress
Control buttons has been changed to "navigation" mode.
1/15
Related flashcards
Related practice
Recommended videos
Two Proportions definitions
Two Proportions
15 Terms
Two Proportions
10. Hypothesis Testing for Two Samples
10 problems
Topic
Justin
10. Hypothesis Testing for Two Samples
3 topics
15 problems
Chapter
Ally
Guided course
10:28
Difference in Proportions: Hypothesis Tests Example 1
186
views
3
rank
Guided course
09:24
Difference in Proportions: Confidence Intervals Example 2
142
views
2
rank
Guided course
05:01
Two Proportions Inferences Using a TI-84
100
views
Terms in this set (15)
Hide definitions
What is the null hypothesis (H0) when testing two population proportions?
The null hypothesis is that the two proportions are equal, or p1 = p2.
How do you write the alternative hypothesis (Ha) if you are testing for any difference between two proportions?
The alternative hypothesis is p1 ≠ p2, indicating a two-tailed test.
What is the formula for the test statistic (z) in a two-proportion hypothesis test?
The formula is z = (p̂1 - p̂2) / sqrt[p̄q̄(1/n1 + 1/n2)], where p̄ is the pooled proportion.
How do you calculate the pooled proportion (p̄) for two samples?
Add all successes from both samples and divide by the total number of trials: p̄ = (x1 + x2) / (n1 + n2).
What conditions must be checked before performing a two-proportion z-test?
Each sample must be random and independent, and both must have at least 5 successes and 5 failures.
How do you calculate the sample proportions p̂1 and p̂2?
Divide the number of successes by the sample size for each group: p̂1 = x1/n1 and p̂2 = x2/n2.
What does it mean if the p-value is greater than the significance level (alpha) in a two-proportion test?
You fail to reject the null hypothesis, indicating there is not enough evidence of a difference.
How do you interpret a confidence interval for the difference in two proportions if it includes zero?
If zero is within the interval, you fail to reject the null hypothesis, suggesting no significant difference.
What is the point estimate when constructing a confidence interval for two proportions?
The point estimate is the difference in sample proportions: p̂1 - p̂2.
How is the margin of error (E) calculated for a confidence interval of two proportions?
E = z* × sqrt[(p̂1q̂1/n1) + (p̂2q̂2/n2)], using individual sample proportions, not the pooled proportion.
What critical value (z*) do you use for a 90% confidence interval?
The critical z value for a 90% confidence interval is 1.645.
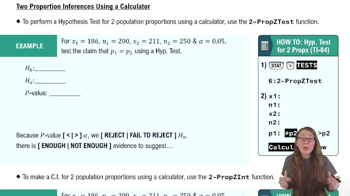
When using a TI-84 calculator, which function is used for a two-proportion hypothesis test?
Use the 2-PropZTest function on the TI-84 calculator.
What does it mean if the confidence interval for p1 - p2 does not include zero?
It means there is enough evidence to suggest a significant difference between the two proportions.
How do you decide whether to reject the null hypothesis using the p-value?
If the p-value is less than alpha, reject the null hypothesis; otherwise, fail to reject it.
What is the relationship between hypothesis testing and confidence intervals for two proportions?
Both methods test for differences; if the confidence interval includes zero, you fail to reject H0, matching the hypothesis test result.
 BackBack


 10:28
10:28