Skip to main content
Statistics for Business
My Course
Learn
Exam Prep
AI Tutor
Study Guides
Flashcards
Explore
Try the app
My Course
Learn
Exam Prep
AI Tutor
Study Guides
Flashcards
Explore
Try the app
Back
Two Variances - Graphing Calculator definitions
You can tap to flip the card.
Two-Sample F-Test
You can tap to flip the card.
👆
Two-Sample F-Test
A statistical procedure comparing two population variances or standard deviations using sample data.
Track progress
Control buttons has been changed to "navigation" mode.
1/15
Related flashcards
Related practice
Recommended videos
Two Variances - Graphing Calculator quiz
Two Variances - Graphing Calculator
15 Terms
10. Hypothesis Testing for Two Samples
3 topics
15 problems
Chapter
Ally
Guided course
04:10
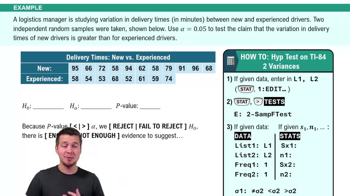
Hypothesis Test for Two Variances Using a TI-84 Example 1
58
views
Guided course
07:07
Hypothesis Test for Two Variances Using a TI-84
70
views
Terms in this set (15)
Hide definitions
Two-Sample F-Test
A statistical procedure comparing two population variances or standard deviations using sample data.
Variance
A measure of data spread, calculated as the average squared deviation from the mean.
Standard Deviation
A measure indicating the typical distance of data points from the mean in a dataset.
F-Statistic
A ratio of two sample variances used to assess if population variances differ significantly.
P-Value
A probability quantifying the evidence against the null hypothesis in a statistical test.
Null Hypothesis
A default assumption stating no difference exists between population variances or standard deviations.
Alternative Hypothesis
A claim suggesting one population variance or standard deviation exceeds the other.
Alpha Level
A threshold probability, such as 0.05, used to determine statistical significance in hypothesis testing.
Sample Statistics
Numerical summaries, like sample size and standard deviation, calculated from collected data.
Raw Data
Original, unprocessed values collected from observations or experiments.
Right-Tailed Test
A hypothesis test where the alternative hypothesis claims one variance is greater than the other.
Stat Menu
A calculator interface section for accessing statistical functions, including hypothesis tests.
Test Tab
A calculator menu area where various hypothesis tests, such as the two-sample F-test, are selected.
Sample Size
The number of observations or data points in a sample.
Confidence Level
The probability, often expressed as a percentage, that a statistical conclusion is correct.
 BackBack
 04:10
04:10