Skip to main content
Statistics for Business
My Course
Learn
Exam Prep
AI Tutor
Study Guides
Flashcards
Explore
Try the app
My Course
Learn
Exam Prep
AI Tutor
Study Guides
Flashcards
Explore
Try the app
Back
Two-Way ANOVA definitions
You can tap to flip the card.
Two-Way ANOVA
You can tap to flip the card.
👆
Two-Way ANOVA
Statistical method comparing three or more means across two factors to assess their individual and combined effects on a dependent variable.
Track progress
Control buttons has been changed to "navigation" mode.
1/15
Related flashcards
Related practice
Recommended videos
Two-Way ANOVA quiz
Two-Way ANOVA
15 Terms
14. ANOVA
1 topic
15 problems
Chapter
Ally
Guided course
08:17
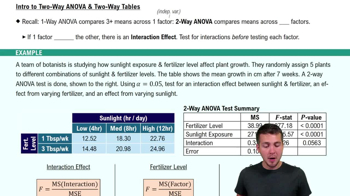
Intro to Two-Way ANOVA & Two-Way Tables
96
views
1
rank
Guided course
06:35
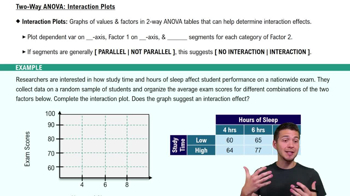
Two-Way ANOVA: Interaction Plots
74
views
Guided course
05:00
Intro to Two-Way ANOVA & Two-Way Tables Example 1
77
views
1
rank
Terms in this set (15)
Hide definitions
Two-Way ANOVA
Statistical method comparing three or more means across two factors to assess their individual and combined effects on a dependent variable.
Factor
Categorical variable whose levels are used to group data and assess their influence on the measured outcome.
Dependent Variable
Measured outcome in an experiment, influenced by the levels of the factors under study.
Interaction Effect
Situation where the impact of one factor on the outcome depends on the level of another factor.
Null Hypothesis
Assumption stating no effect or no interaction exists between factors or on the dependent variable.
Alternative Hypothesis
Statement proposing that an effect or interaction exists between factors or on the dependent variable.
F Statistic
Ratio of mean squares used to compare group variances and test hypotheses in ANOVA.
P-Value
Probability measure indicating the likelihood of observing the data if the null hypothesis is true.
Alpha Level
Threshold probability used to decide whether to reject the null hypothesis, commonly set at 0.05.
Mean Square
Average of squared deviations, used in ANOVA calculations to partition variance among sources.
Error
Variation in the dependent variable not explained by the factors or their interaction.
Interaction Plot
Graphical tool displaying means for combinations of factor levels to visually assess interaction effects.
Parallel Lines
Pattern in an interaction plot indicating independent effects of factors without interaction.
Non-Parallel Lines
Pattern in an interaction plot suggesting the presence of interaction effects between factors.
Significance Level
Chosen probability cutoff for determining statistical significance in hypothesis testing.
 BackBack
 08:17
08:17