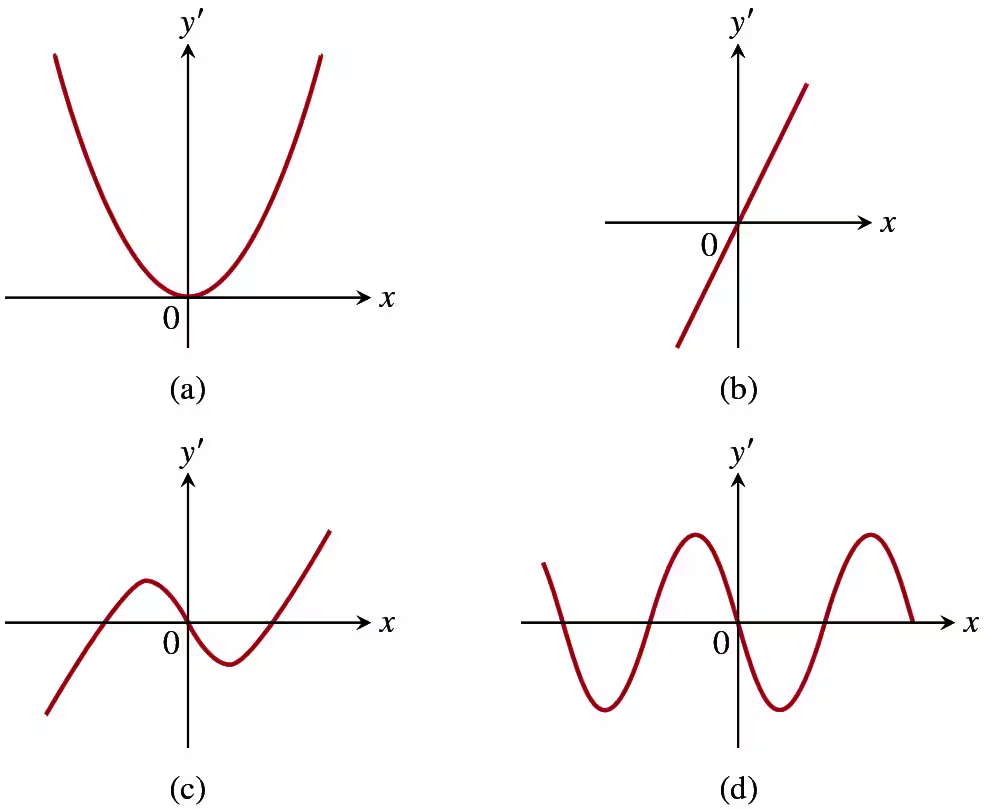
Match the functions graphed in Exercises 27–30 with the derivatives graphed in the accompanying figures (a)–(d).
Verified step by step guidance
1
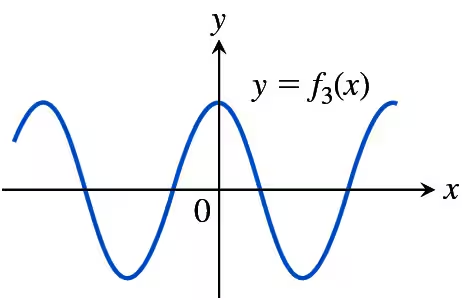
Observe the graph of the function y = f₃(x). It is a sinusoidal wave with alternating peaks and troughs, indicating periodic behavior. The derivative of this function will represent the slope of the tangent line at each point on the curve.
Identify the key features of the graph of y = f₃(x): the slope is zero at the peaks and troughs (where the graph changes direction), and the slope is steepest at the midpoints between peaks and troughs.
Match these features to the derivative graphs (a)–(d). The derivative graph should cross the x-axis at the points where the original function has peaks and troughs (since the slope is zero there). It should also have maximum and minimum values where the original function has the steepest slopes.
Compare the periodicity of the original function to the derivative graphs. The derivative graph should have the same periodicity as the original function, but it may be shifted in phase.
Based on these observations, the derivative graph that matches y = f₃(x) is graph (d), as it exhibits the correct periodicity, zero crossings, and amplitude changes corresponding to the slopes of the original function.
Verified video answer for a similar problem:
This video solution was recommended by our tutors as helpful for the problem above
Video duration:
4m
Play a video:
0 Comments
Key Concepts
Here are the essential concepts you must grasp in order to answer the question correctly.
Derivative and Slope
The derivative of a function at a point is the slope of the tangent line to the graph of the function at that point. It provides information about the rate of change of the function. For example, if the derivative is positive, the function is increasing at that point, while a negative derivative indicates a decreasing function.
Critical points occur where the derivative of a function is zero or undefined, indicating potential local maxima, minima, or points of inflection. By analyzing the sign changes of the derivative around these points, one can determine the nature of these critical points, such as whether they are peaks, troughs, or inflection points.
Graphically, the derivative of a function can be visualized as a new graph that represents the slope of the original function at each point. For instance, a quadratic function's derivative is linear, and a cubic function's derivative is quadratic. Understanding this relationship helps in matching functions with their derivatives by observing the shapes and behaviors of their graphs.

 Verified step by step guidance
 05:13
05:13
