Determine whether the following statements are true and give an explanation or counterexample.
e. . (Hint: Graph y=cot x)
Verified step by step guidance
1
insert step 1: Recall the definition of the cotangent function, which is \( \cot x = \frac{\cos x}{\sin x} \).
insert step 2: Consider the behavior of \( \sin x \) and \( \cos x \) as \( x \to \frac{\pi}{2} \). Note that \( \sin \left( \frac{\pi}{2} \right) = 1 \) and \( \cos \left( \frac{\pi}{2} \right) = 0 \).
insert step 3: Substitute these values into the cotangent function: \( \cot x = \frac{\cos x}{\sin x} \to \frac{0}{1} = 0 \).
insert step 4: However, consider the limit \( \lim_{x \to \frac{\pi}{2}} \cot x \). As \( x \) approaches \( \frac{\pi}{2} \) from the left, \( \cos x \) approaches 0, but \( \sin x \) is positive and close to 1, making \( \cot x \) approach 0.
insert step 5: As \( x \) approaches \( \frac{\pi}{2} \) from the right, \( \cos x \) is still approaching 0, but \( \sin x \) is negative and close to -1, making \( \cot x \) approach 0. Thus, the limit does not exist as it approaches different values from the left and right.
Verified video answer for a similar problem:
This video solution was recommended by our tutors as helpful for the problem above
Video duration:
1m
Play a video:
0 Comments
Key Concepts
Here are the essential concepts you must grasp in order to answer the question correctly.
Limit of a Function
The limit of a function describes the behavior of that function as the input approaches a certain value. In this case, we are interested in the limit of the cotangent function as x approaches π/2. Understanding limits is crucial for analyzing the continuity and behavior of functions at specific points, especially where they may not be defined.
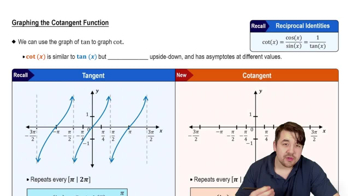
The cotangent function, denoted as cot(x), is the reciprocal of the tangent function, defined as cot(x) = cos(x)/sin(x). It is important to note that cot(x) is undefined at points where sin(x) = 0, such as x = nπ, where n is an integer. This characteristic affects the limit as x approaches π/2, where the function exhibits vertical asymptotic behavior.
Graphical analysis involves examining the graph of a function to understand its behavior visually. For the cotangent function, plotting y = cot(x) reveals that as x approaches π/2, the function tends toward negative infinity, not zero. This visual representation helps clarify the limit's value and provides insight into the function's discontinuities and asymptotes.

 Verified step by step guidance
 06:11
06:11