Sketch the graph of a twice-differentiable function y=f(x) that passes through the points (-2,2), (-1,1), (0,0),(1,1), and (2,2) and whose first two derivatives have the following sign patterns.
Verified step by step guidance
1
Identify the intervals where the first derivative y' is positive or negative. The function is increasing where y' is positive and decreasing where y' is negative. From the image, y' is positive on the intervals (-∞, -2), (0, 2) and negative on (-2, 0), (2, ∞).
Identify the intervals where the second derivative y'' is positive or negative. The function is concave up where y'' is positive and concave down where y'' is negative. From the image, y'' is negative on (-∞, -1), (1, ∞) and positive on (-1, 1).
Determine the critical points and inflection points. Critical points occur where y' changes sign, which are at x = -2, 0, and 2. Inflection points occur where y'' changes sign, which are at x = -1 and 1.
Sketch the graph using the information from the derivatives. Start by plotting the given points (-2,2), (-1,1), (0,0), (1,1), and (2,2). Use the sign of y' to determine where the function is increasing or decreasing and the sign of y'' to determine the concavity.
Connect the points smoothly, ensuring that the graph reflects the increasing/decreasing behavior and concavity as determined by the derivatives. The graph should increase from (-∞, -2), decrease from (-2, 0), increase from (0, 2), and decrease from (2, ∞), with concave down sections from (-∞, -1) and (1, ∞), and concave up from (-1, 1).
Verified video answer for a similar problem:
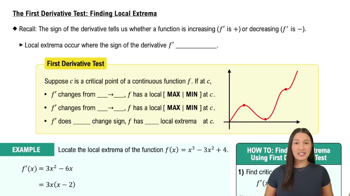
This video solution was recommended by our tutors as helpful for the problem above
Video duration:
3m
Play a video:
0 Comments
Key Concepts
Here are the essential concepts you must grasp in order to answer the question correctly.
First Derivative Test
The first derivative of a function, denoted as f'(x), indicates the slope of the tangent line at any point on the graph. The sign of the first derivative reveals whether the function is increasing (positive) or decreasing (negative). In this question, the sign pattern of f'(x) helps identify intervals of increase and decrease, which is crucial for sketching the graph.
The second derivative, f''(x), provides information about the concavity of the function. If f''(x) is positive, the graph is concave up, while a negative f''(x) indicates concave down. The sign pattern of the second derivative in the question helps determine the nature of critical points and the overall shape of the graph, which is essential for accurate sketching.
Critical points occur where the first derivative is zero or undefined, indicating potential local maxima or minima. Inflection points are where the second derivative changes sign, indicating a change in concavity. Understanding these points is vital for sketching the function accurately, as they dictate where the graph changes direction or curvature.