Here are the essential concepts you must grasp in order to answer the question correctly.
Asymptotes
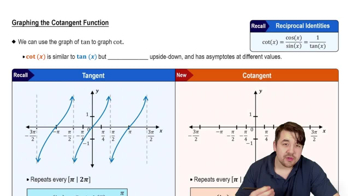
Asymptotes are lines that a graph approaches but never touches. They can be vertical, horizontal, or oblique. Vertical asymptotes occur where the function is undefined, typically at values that make the denominator zero. Horizontal asymptotes indicate the behavior of the function as x approaches infinity, showing the end behavior of the graph.
Recommended video:
Introduction to Cotangent Graph
Graphing Rational Functions
Graphing rational functions involves plotting the function defined as the ratio of two polynomials. Key steps include identifying intercepts, asymptotes, and the behavior of the function at critical points. Understanding the degree of the numerator and denominator helps predict the end behavior and the presence of horizontal asymptotes.
Recommended video:
Graph of Sine and Cosine Function
Error Correction in Graphing
Error correction in graphing involves comparing a computer-generated graph with a hand-drawn sketch to identify discrepancies. This process requires understanding the function's characteristics, such as asymptotes and intercepts, to ensure accuracy. By analyzing the graph's behavior at critical points, one can refine the sketch to better represent the function.
Recommended video:
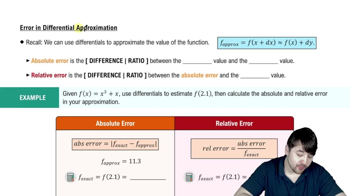
Determining Error and Relative Error