Graph the functions in Exercises 37–46. What symmetries, if any, do the graphs have? Specify the intervals over which the function is increasing and the intervals where it is decreasing.
y = (−x)²/³
Verified step by step guidance
1
First, understand the function y = (-x)^(2/3). This function involves a fractional exponent, which can be rewritten as y = ((-x)^2)^(1/3). This means we are taking the cube root of the square of -x.
Next, consider the symmetry of the function. A function is symmetric about the y-axis if f(x) = f(-x) for all x in the domain. Substitute -x into the function: y = ((-(-x))^2)^(1/3) = (x^2)^(1/3). Since this is equal to the original function, the graph is symmetric about the y-axis.
To determine where the function is increasing or decreasing, find the derivative of y with respect to x. Use the chain rule: if y = u^(1/3) where u = (-x)^2, then dy/dx = (1/3)u^(-2/3) * du/dx. Calculate du/dx = 2(-x)(-1) = 2x.
Substitute du/dx into the derivative: dy/dx = (1/3)((-x)^2)^(-2/3) * 2x. Simplify this expression to find the critical points where the derivative is zero or undefined, which will help identify intervals of increase and decrease.
Analyze the sign of the derivative on intervals determined by the critical points. If dy/dx > 0, the function is increasing on that interval; if dy/dx < 0, the function is decreasing. Use this information to specify the intervals of increase and decrease for the function.
Verified video answer for a similar problem:
This video solution was recommended by our tutors as helpful for the problem above
Video duration:
6m
Play a video:
0 Comments
Key Concepts
Here are the essential concepts you must grasp in order to answer the question correctly.
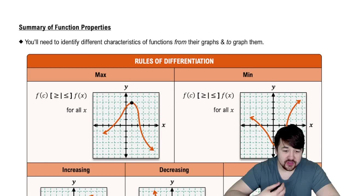
Increasing and Decreasing Functions
A function is considered increasing on an interval if, for any two points within that interval, the function's value at the second point is greater than at the first. Conversely, a function is decreasing if the value at the second point is less than at the first. Identifying these intervals involves analyzing the first derivative of the function, where positive values indicate increasing behavior and negative values indicate decreasing behavior.
Determining Where a Function is Increasing & Decreasing
Graphing Functions
Graphing a function involves plotting its points on a coordinate plane to visualize its behavior. This includes identifying key features such as intercepts, turning points, and asymptotes. For the function y = (−x)²/³, understanding its shape and symmetry is crucial, as it helps in determining where the function increases or decreases and how it behaves at different values of x.
Symmetry in functions refers to the property where a function exhibits a mirror-like behavior about a specific axis or point. For example, a function is even if f(x) = f(-x) for all x, indicating symmetry about the y-axis, and odd if f(-x) = -f(x), indicating symmetry about the origin. Analyzing the symmetry of the function y = (−x)²/³ can provide insights into its overall shape and the intervals of increase and decrease.

 Verified step by step guidance
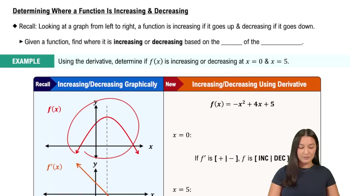
 07:32
07:32