Here are the essential concepts you must grasp in order to answer the question correctly.
Graph Interpretation
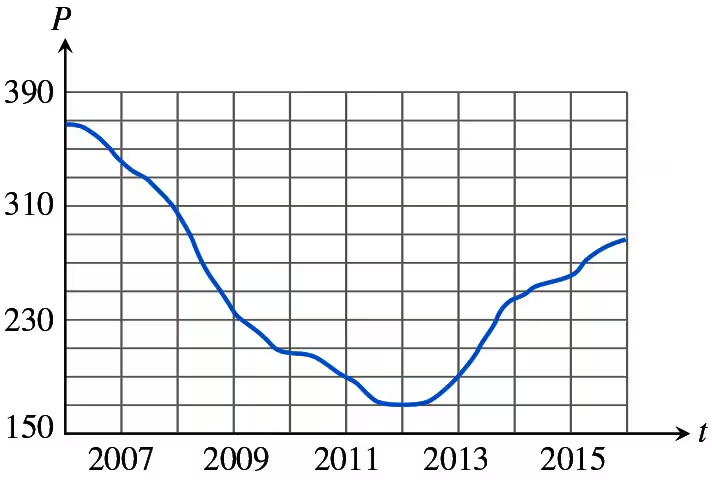
Understanding how to read and interpret graphs is crucial in calculus, especially when analyzing trends over time. In this case, the graph shows the average home prices in Sacramento from 2006 to 2015, highlighting key points such as peaks and troughs. Being able to extract numerical values from the graph at specific years is essential for estimating home prices.
Recommended video:
Estimation Techniques
Estimation techniques involve using visual data to approximate values that may not be explicitly stated. In this context, students need to estimate home prices at the end of 2007, 2012, and 2015 by analyzing the graph. This skill is important in calculus for making informed predictions based on available data.
Recommended video:
Estimating the Area Under a Curve with Right Endpoints & Midpoint
Trends and Patterns
Identifying trends and patterns in data is a fundamental concept in calculus and statistics. The graph illustrates a significant peak in home prices in 2007 followed by a decline until 2012, and a gradual recovery thereafter. Recognizing these trends helps in understanding the economic factors influencing home prices over time.
Recommended video: