


Textbook Question
Identifying Parametric Equations in the Plane
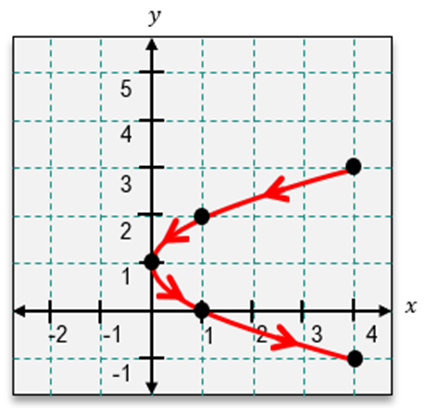
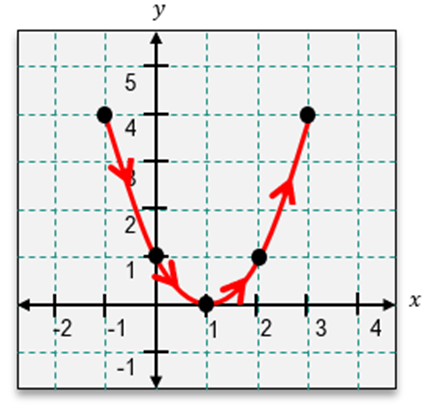
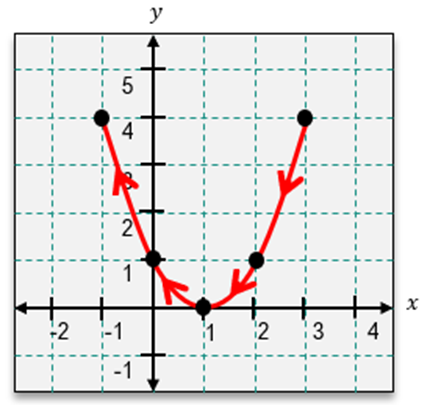
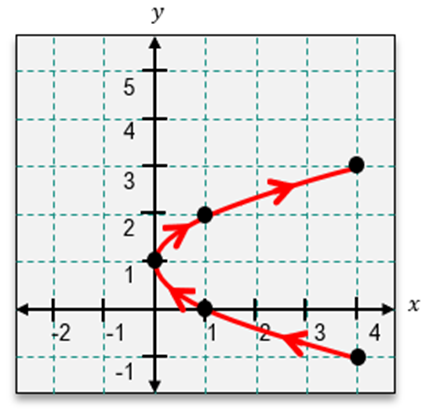
Exercises 1–6 give parametric equations and parameter intervals for the motion of a particle in the xy-plane. Identify the particle’s path by finding a Cartesian equation for it. Graph the Cartesian equation and indicate the direction of motion and the portion traced by the particle.
x = 4 cos t, y = 9 sin t, 0 ≤ t ≤ 2π
29
views

