Join thousands of students who trust us to help them ace their exams!
Multiple Choice
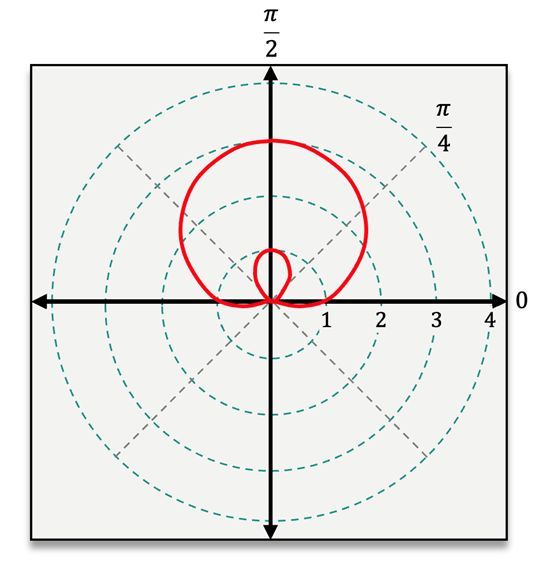
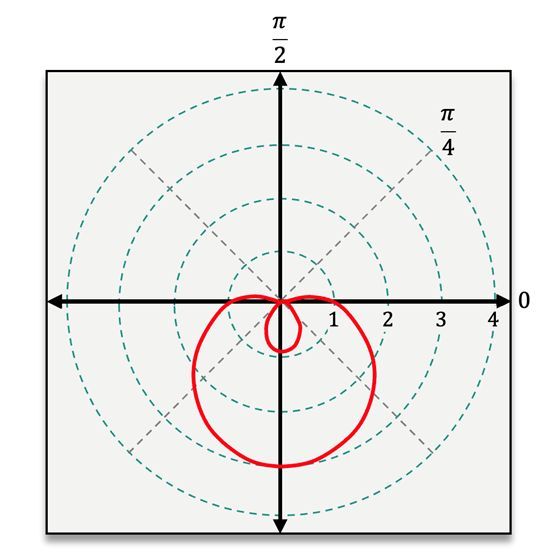
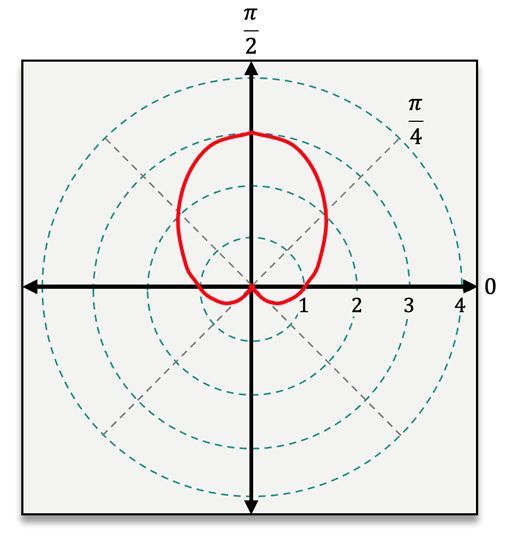
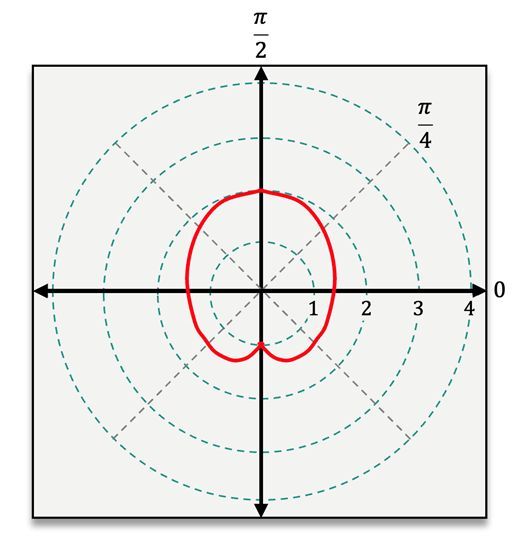
Graph r=1+2sinθ
A
B
C
D
0 Comments
Verified step by step guidance
1
Step 1: Recognize that the given equation is in polar form, r = 1 + 2sinθ. This represents a polar curve where r is the radial distance and θ is the angle in radians.
Step 2: Analyze the behavior of the equation. The term 2sinθ oscillates between -2 and 2, so r will vary between 1 - 2 = -1 (negative radius) and 1 + 2 = 3. Negative values of r indicate that the curve loops back through the origin.
Step 3: Plot key points by substituting specific values of θ (e.g., θ = 0, π/2, π, 3π/2, 2π) into the equation to calculate corresponding values of r. This helps identify the shape and symmetry of the graph.
Step 4: Observe that the curve exhibits symmetry about the vertical axis (polar axis) because the sine function is symmetric about θ = π/2. This symmetry helps simplify the graphing process.
Step 5: Use the calculated points and symmetry to sketch the graph. The curve will form a loop near the origin due to the negative values of r and extend outward to a maximum radius of 3. The resulting graph is a limacon with an inner loop.


 Verified step by step guidance
