
Textbook Question
Identifying Extrema
In Exercises 19–40:
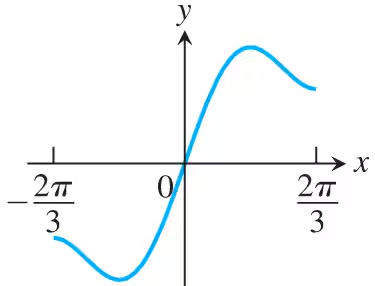
b. Identify the function’s local extreme values, if any, saying where they occur.
f(θ) = 3θ² − 4θ³
138
views
 Verified step by step guidanceVerified video answer for a similar problem:
 04:50
04:50 07:09
07:09 05:59
05:59