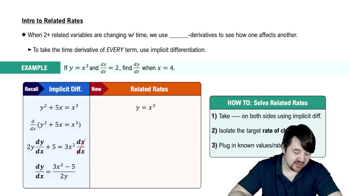
A GPS device tracks the elevation E (in feet) of a hiker walking in the mountains. The elevation thours after beginning the hike is given in the figure. <IMAGE> Repeat the procedure outlined in part (a) for the secant line that passes through points Pand Q.
Verified step by step guidance
1
Identify the coordinates of points P and Q on the graph. These points represent the elevation at specific times during the hike.
Determine the coordinates of point P, which is given as (t1, E1), where t1 is the time in hours and E1 is the elevation in feet at that time.
Determine the coordinates of point Q, which is given as (t2, E2), where t2 is the time in hours and E2 is the elevation in feet at that time.
Use the formula for the slope of a secant line, which is (E2 - E1) / (t2 - t1), to calculate the average rate of change of elevation between points P and Q.
Interpret the slope of the secant line as the average rate of change of elevation with respect to time between the two points, providing insight into the hiker's change in elevation over that interval.
Verified video answer for a similar problem:
This video solution was recommended by our tutors as helpful for the problem above
Video duration:
4m
Play a video:
0 Comments
Key Concepts
Here are the essential concepts you must grasp in order to answer the question correctly.
Secant Line
A secant line is a straight line that intersects a curve at two or more points. In the context of calculus, it is often used to approximate the slope of the curve between those points. The slope of the secant line can be calculated using the formula (E(Q) - E(P)) / (t(Q) - t(P)), where E represents elevation and t represents time. This concept is fundamental for understanding the average rate of change of a function over an interval.
The average rate of change of a function over an interval gives a measure of how much the function's output changes per unit of input over that interval. It is calculated as the difference in the function values at the endpoints of the interval divided by the difference in the input values. This concept is crucial for interpreting the behavior of functions and is foundational for understanding derivatives, which represent instantaneous rates of change.
In calculus, functions can be represented graphically, numerically, or algebraically. The graphical representation, often depicted in a coordinate system, allows for visual analysis of the function's behavior, such as identifying slopes, intercepts, and trends. Understanding how to interpret these representations is essential for solving problems related to rates of change, limits, and continuity, which are core topics in calculus.

 Verified step by step guidance
 05:13
05:13