For each equation, (a) give a table with at least three ordered pairs that are solutions, and (b) graph the equation. y=-|x+4|
Table of contents
- 0. Review of Algebra4h 18m
- 1. Equations & Inequalities3h 18m
- 2. Graphs of Equations1h 43m
- 3. Functions2h 17m
- 4. Polynomial Functions1h 44m
- 5. Rational Functions1h 23m
- 6. Exponential & Logarithmic Functions2h 28m
- 7. Systems of Equations & Matrices4h 5m
- 8. Conic Sections2h 23m
- 9. Sequences, Series, & Induction1h 22m
- 10. Combinatorics & Probability1h 45m
3. Functions
Intro to Functions & Their Graphs
Problem 31
Textbook Question
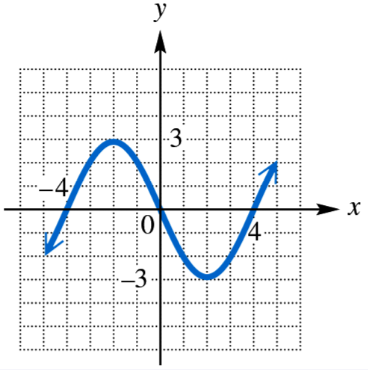
Determine whether each relation defines a function, and give the domain and range.

 Verified step by step guidance
1
Step 1: Determine if the relation defines a function by using the Vertical Line Test. This test states that if any vertical line intersects the graph at more than one point, the relation is not a function.
Step 2: Observe the graph and check if any vertical line crosses the curve more than once. If no vertical line intersects the graph at multiple points, then the relation is a function.
Step 3: Identify the domain of the function by looking at the x-values covered by the graph. The domain includes all x-values from the leftmost point to the rightmost point on the graph.
Step 4: Identify the range of the function by looking at the y-values covered by the graph. The range includes all y-values from the lowest point to the highest point on the graph.
Step 5: Write the domain and range using interval notation, based on the minimum and maximum x and y values observed on the graph.
 Verified video answer for a similar problem:
This video solution was recommended by our tutors as helpful for the problem above
Video duration:
3mPlay a video:
Key Concepts
Here are the essential concepts you must grasp in order to answer the question correctly.
Definition of a Function
A function is a relation where each input (x-value) corresponds to exactly one output (y-value). This means no vertical line intersects the graph more than once, ensuring each x has a unique y. Understanding this helps determine if a relation is a function by applying the vertical line test.
Recommended video:

Graphs of Common Functions
Domain of a Function
The domain is the set of all possible input values (x-values) for which the function is defined. On a graph, it corresponds to the horizontal extent of the curve. Identifying the domain involves finding the minimum and maximum x-values covered by the graph.
Recommended video:

Domain Restrictions of Composed Functions
Range of a Function
The range is the set of all possible output values (y-values) that the function can produce. On a graph, it corresponds to the vertical extent of the curve. Determining the range involves identifying the lowest and highest points on the graph along the y-axis.
Recommended video:

Domain & Range of Transformed Functions

 5:2m
5:2mWatch next
Master Relations and Functions with a bite sized video explanation from Patrick
Start learningRelated Videos
Related Practice
Textbook Question
729
views
