Graph the solution set of each system of inequalities or indicate that the system has no solution. {x+2y≤4y≥x−3
Verified step by step guidance
1
Start by rewriting each inequality to understand the boundary lines. For the first inequality, \(x + 5y \leq 8\), rewrite it in slope-intercept form by isolating \(y\): \(5y \leq 8 - x\), then \(y \leq \frac{8 - x}{5}\).
For the second inequality, \(y \geq x - 6\), the boundary line is \(y = x - 6\). This is already in slope-intercept form with slope 1 and y-intercept -6.
Graph the boundary lines on the coordinate plane. For \(y = \frac{8 - x}{5}\), plot points or use intercepts: when \(x=0\), \(y=\frac{8}{5}\); when \(y=0\), \(x=8\). For \(y = x - 6\), plot points such as \((0, -6)\) and \((6, 0)\).
Determine the shading for each inequality. For \(y \leq \frac{8 - x}{5}\), shade the region below or on the line. For \(y \geq x - 6\), shade the region above or on the line.
The solution set to the system is the intersection of the shaded regions from both inequalities. Identify this overlapping region on the graph, which represents all points satisfying both inequalities simultaneously.
Verified video answer for a similar problem:
This video solution was recommended by our tutors as helpful for the problem above
Video duration:
1m
Play a video:
0 Comments
Key Concepts
Here are the essential concepts you must grasp in order to answer the question correctly.
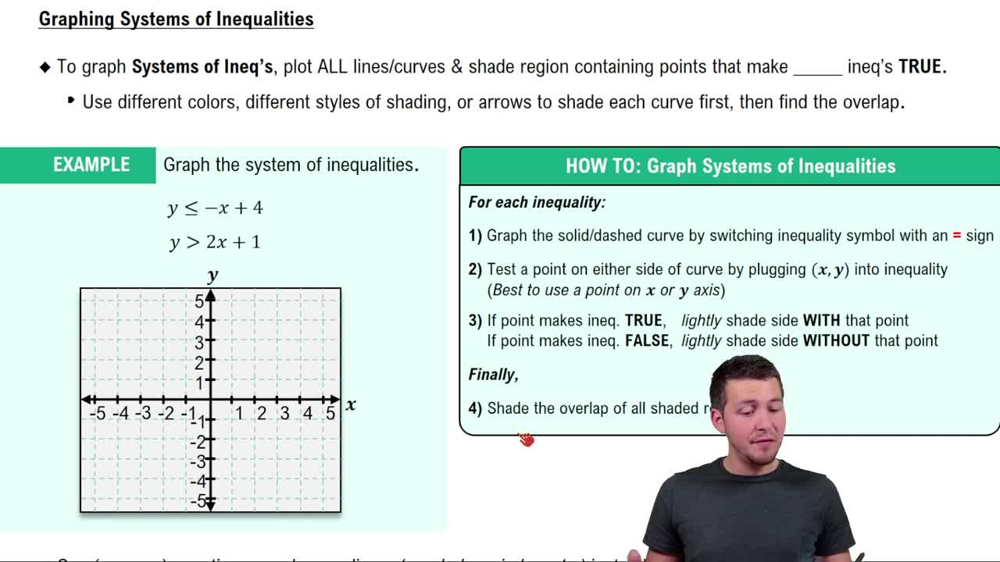
Graphing Linear Inequalities
Graphing linear inequalities involves shading the region of the coordinate plane that satisfies the inequality. The boundary line, given by the related equation, is drawn solid if the inequality includes equality (≤ or ≥) and dashed if it does not (< or >). Points on the shaded side satisfy the inequality.
A system of inequalities consists of two or more inequalities considered together. The solution set is the intersection of the regions that satisfy each inequality individually. Graphing the system helps visualize where these regions overlap, representing all solutions that satisfy every inequality.
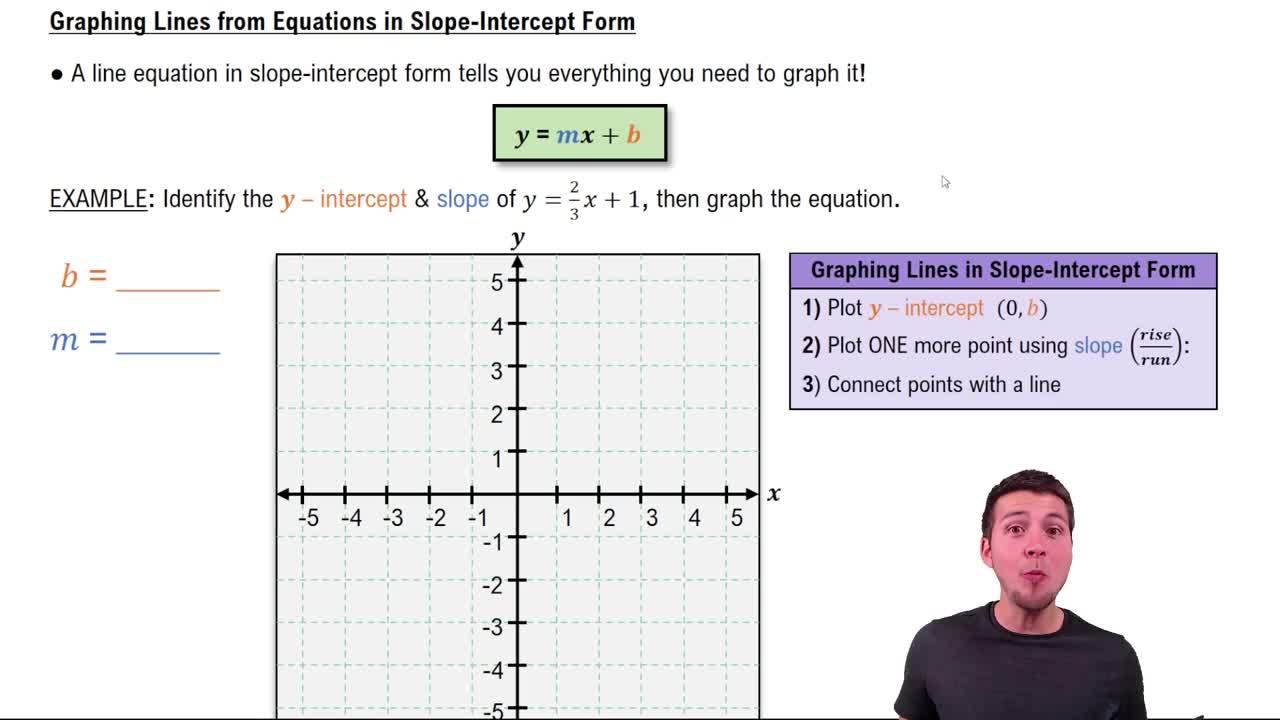
Converting inequalities to slope-intercept form (y = mx + b) helps in graphing the boundary lines easily. For example, y ≤ (-1/5)x + 8/5 is derived from x + 5y ≤ 8. Understanding slope and intercepts allows accurate drawing of boundary lines, which define the edges of the solution regions.

 Verified step by step guidance
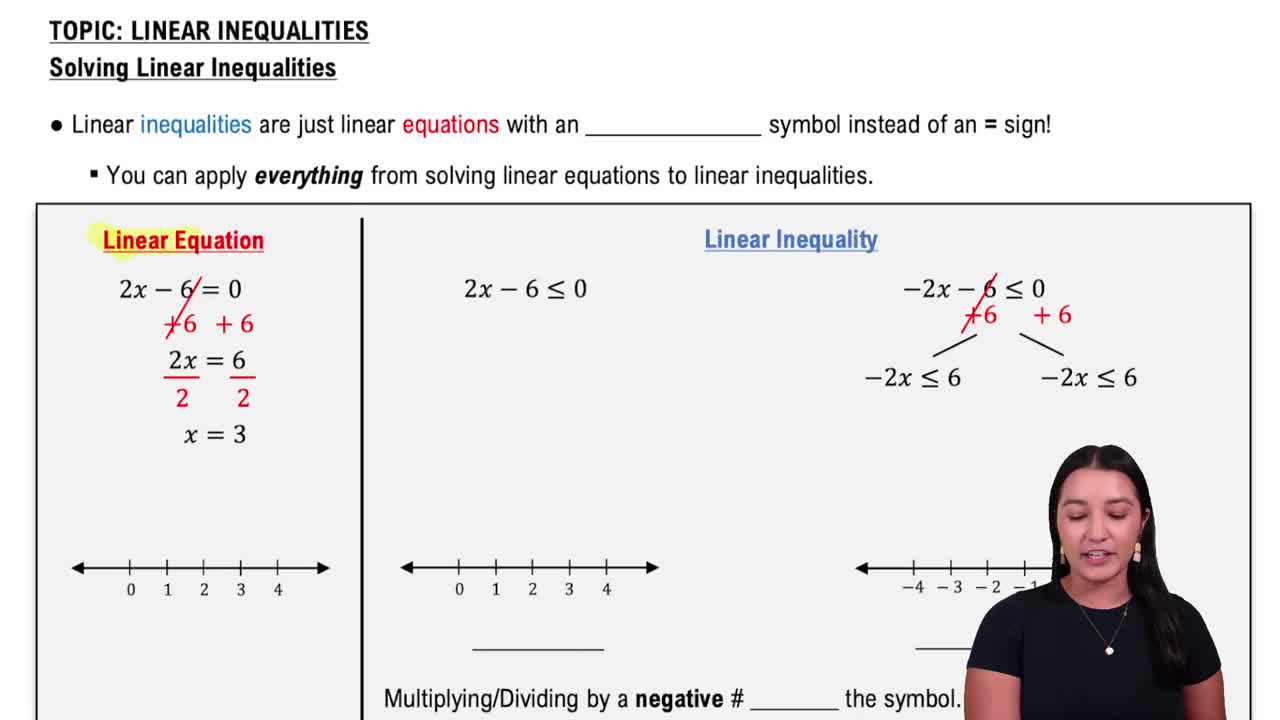
 06:07
06:07