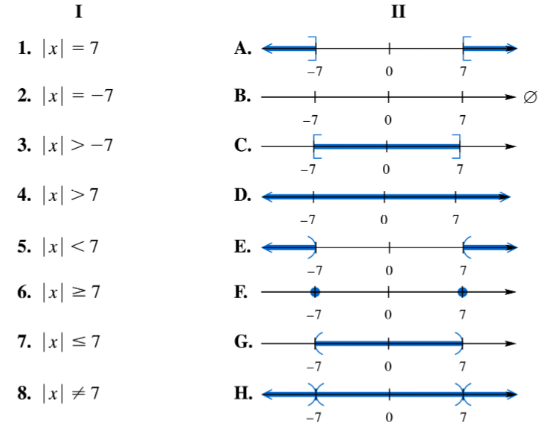
Match each equation or inequality in Column I with the graph of its solution set in Column II. | x | ≠ 7
Verified step by step guidance
1
Understand the inequality \( |x| \neq 7 \) means the absolute value of \( x \) is not equal to 7. This excludes the points where \( x = 7 \) and \( x = -7 \).
Recall that \( |x| = 7 \) corresponds to the two points \( x = 7 \) and \( x = -7 \) on the number line.
Since the inequality is \( |x| \neq 7 \), the solution set includes all real numbers except \( x = 7 \) and \( x = -7 \).
On the graph, this will be represented by the entire number line with open circles (or holes) at \( x = 7 \) and \( x = -7 \), indicating these points are not included.
Match this description to the graph in Column II that shows all points except \( x = 7 \) and \( x = -7 \) excluded.
Verified video answer for a similar problem:
This video solution was recommended by our tutors as helpful for the problem above
Video duration:
2m
Play a video:
0 Comments
Key Concepts
Here are the essential concepts you must grasp in order to answer the question correctly.
Absolute Value
The absolute value of a number represents its distance from zero on the number line, always as a non-negative value. For example, |x| = 7 means x is either 7 or -7, since both are 7 units from zero.
An inequality like |x| ≠ 7 means x cannot be exactly 7 or -7, but can be any other real number. Understanding how to interpret and graph such inequalities is essential for matching them to their solution sets.
Graphing solution sets involves representing all values that satisfy an equation or inequality on a number line. For |x| ≠ 7, the graph excludes points at 7 and -7, showing all other points shaded or included.

 Verified step by step guidance
 7:12
7:12