
Textbook Question
Determine whether each equation has a graph that is symmetric with respect to the x-axis, the y-axis, the origin, or none of these.
1014
views
 Verified step by step guidanceVerified video answer for a similar problem:
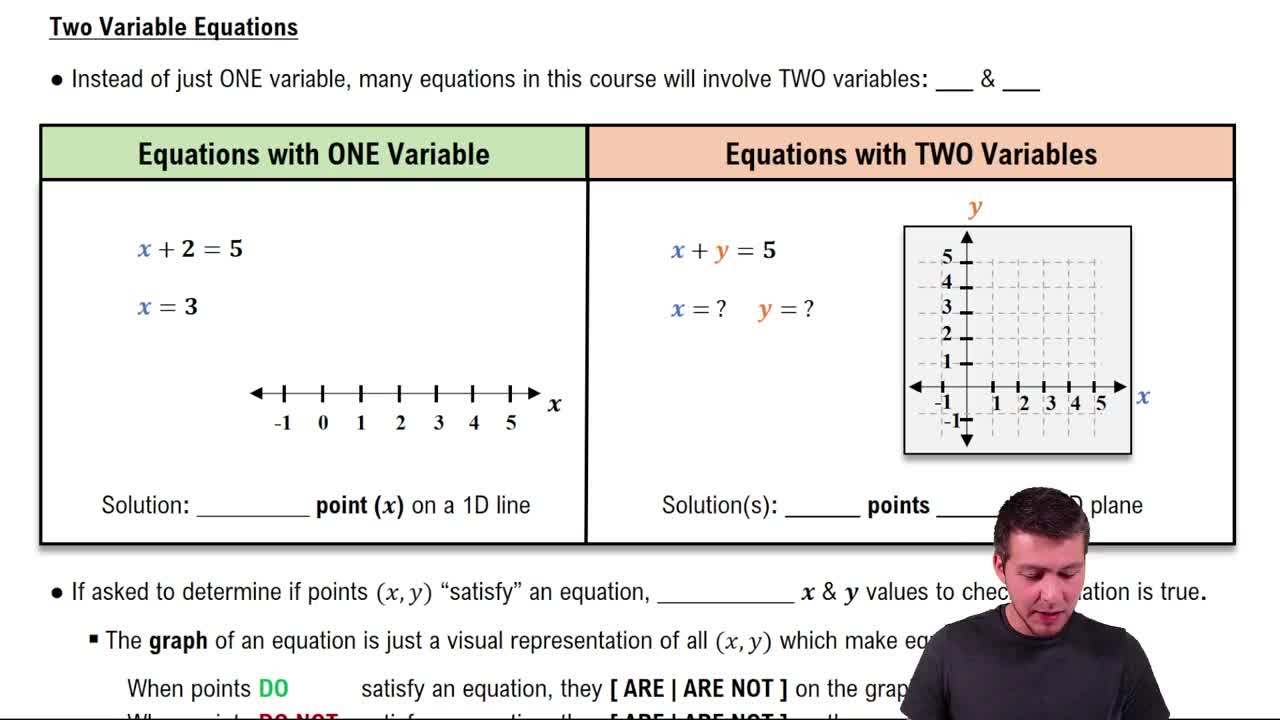
 05:28
05:28 5:26
5:26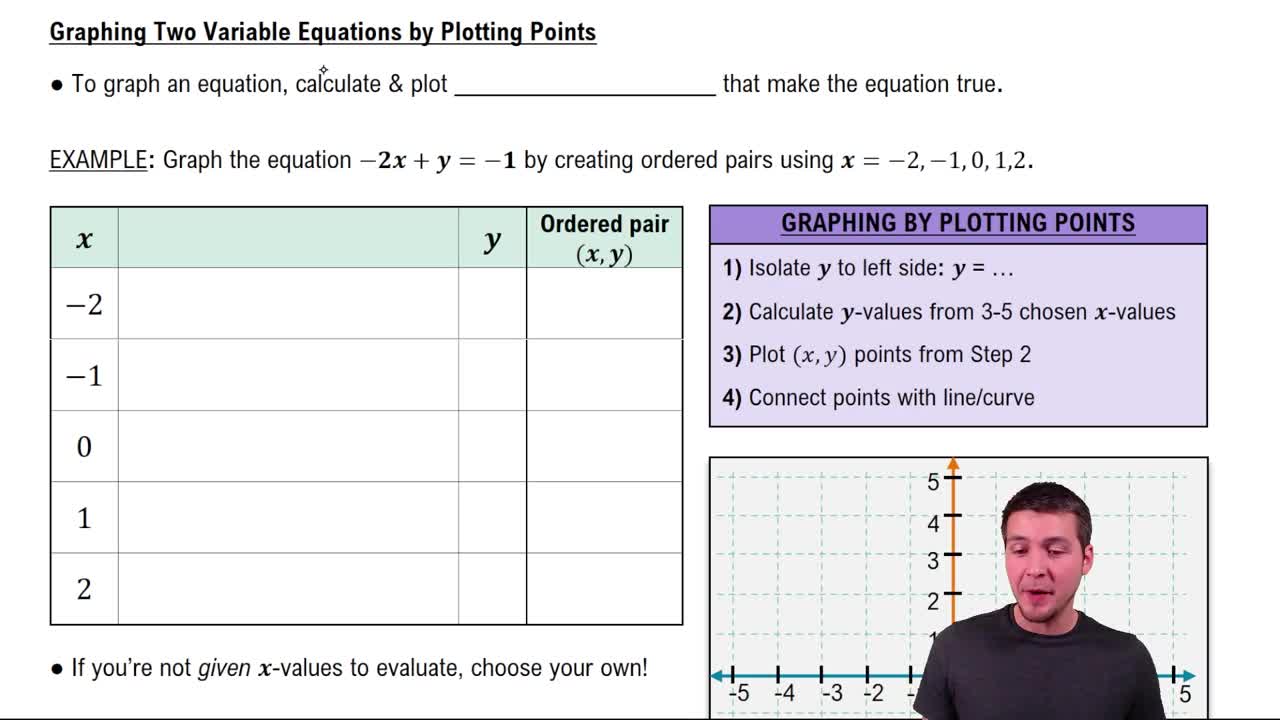 04:29
04:29