
Textbook Question
Work each problem. Which function has a graph that does not have a vertical asymptote?
A. ƒ(x)=1/(x2+2)
B. ƒ(x)=1/(x2-2)
C. ƒ(x)=3/x2
D. ƒ(x)=(2x+1)/(x-8)
575
views
 Verified step by step guidanceVerified video answer for a similar problem:
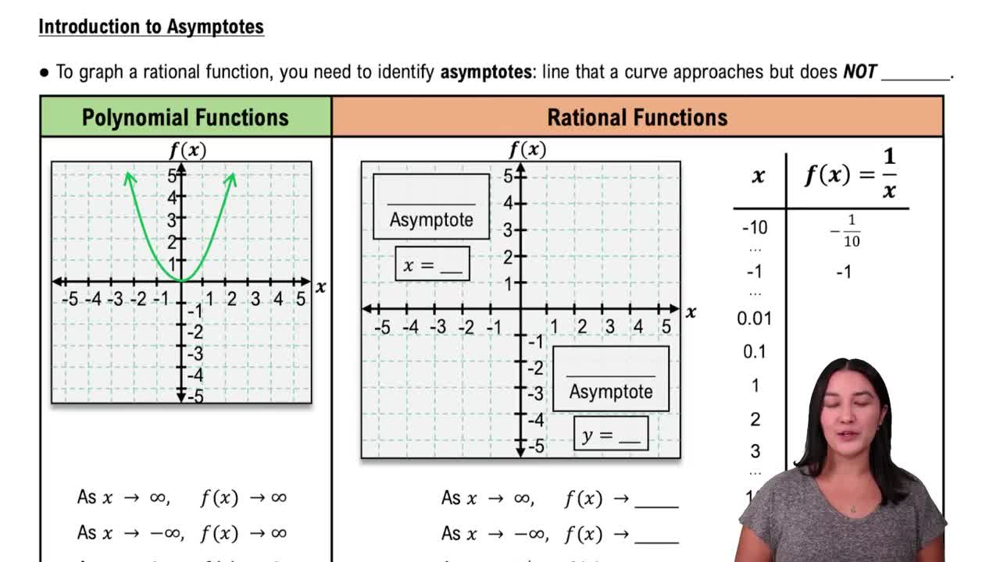
 6:24
6:24 04:08
04:08 8:19
8:19