
Textbook Question
In Exercises 63–64, write each sentence as an inequality in two variables. Then graph the inequality. The y-variable is at least 4 more than the product of -2 and the x-variable.
577
views
 Verified step by step guidanceVerified video answer for a similar problem:
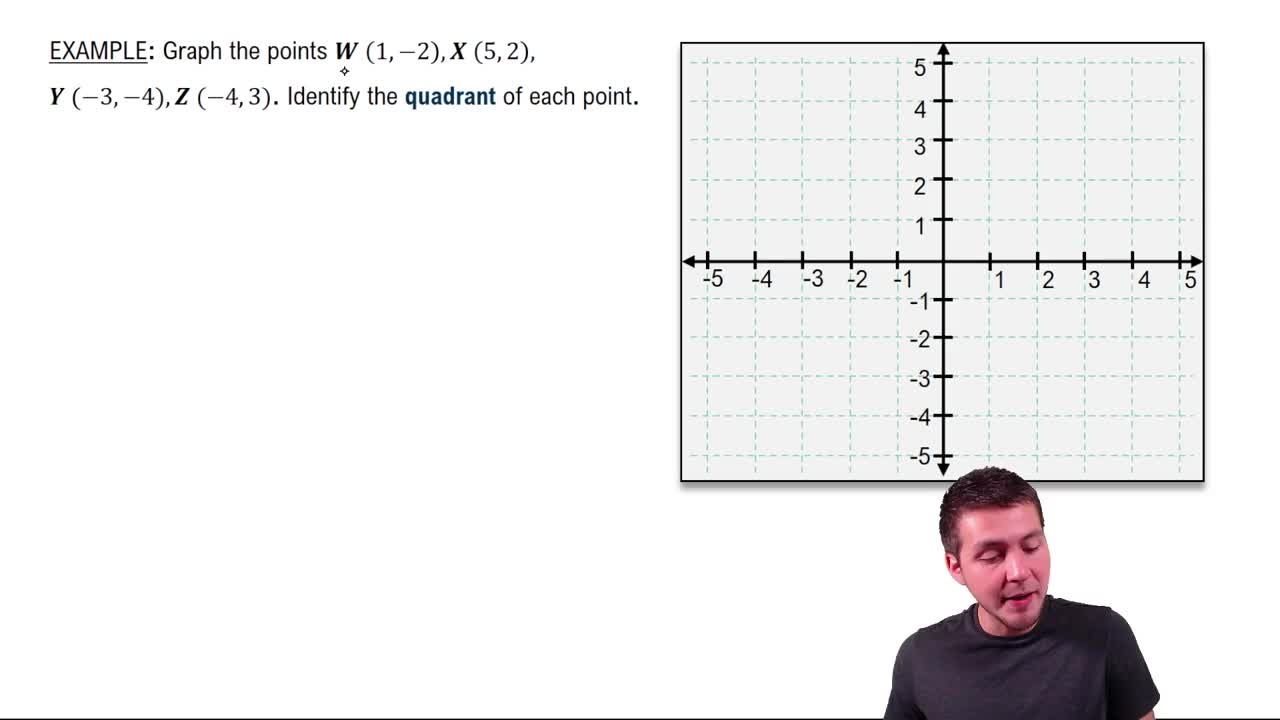
 02:16
02:16 6:37
6:37 4:56
4:56