Solve each quadratic inequality. Give the solution set in interval notation. 2x2 + 5 ≤ 11x
Verified step by step guidance
1
Rewrite the inequality in standard quadratic form by moving all terms to one side: \(2x^{2} + 5 \leq 11x\) becomes \(2x^{2} - 11x + 5 \leq 0\).
Identify the quadratic expression: \$2x^{2} - 11x + 5\(. To solve the inequality, first find the roots of the corresponding quadratic equation \)2x^{2} - 11x + 5 = 0$.
Use the quadratic formula to find the roots: \(x = \frac{-b \pm \sqrt{b^{2} - 4ac}}{2a}\), where \(a=2\), \(b=-11\), and \(c=5\).
Calculate the discriminant \(\Delta = b^{2} - 4ac\) to determine the nature of the roots and then find the exact root values.
Use the roots to divide the number line into intervals, test a value from each interval in the inequality \(2x^{2} - 11x + 5 \leq 0\), and determine which intervals satisfy the inequality. Express the solution set in interval notation.
Verified video answer for a similar problem:
This video solution was recommended by our tutors as helpful for the problem above
Video duration:
5m
Play a video:
0 Comments
Key Concepts
Here are the essential concepts you must grasp in order to answer the question correctly.
Quadratic Inequalities
A quadratic inequality involves a quadratic expression set less than, greater than, or equal to a value. Solving it requires finding the range of x-values that satisfy the inequality, often by analyzing the related quadratic equation and testing intervals.
To solve the inequality, first rewrite it in standard form by moving all terms to one side, resulting in an expression compared to zero. This simplification helps identify critical points and makes it easier to analyze the inequality.
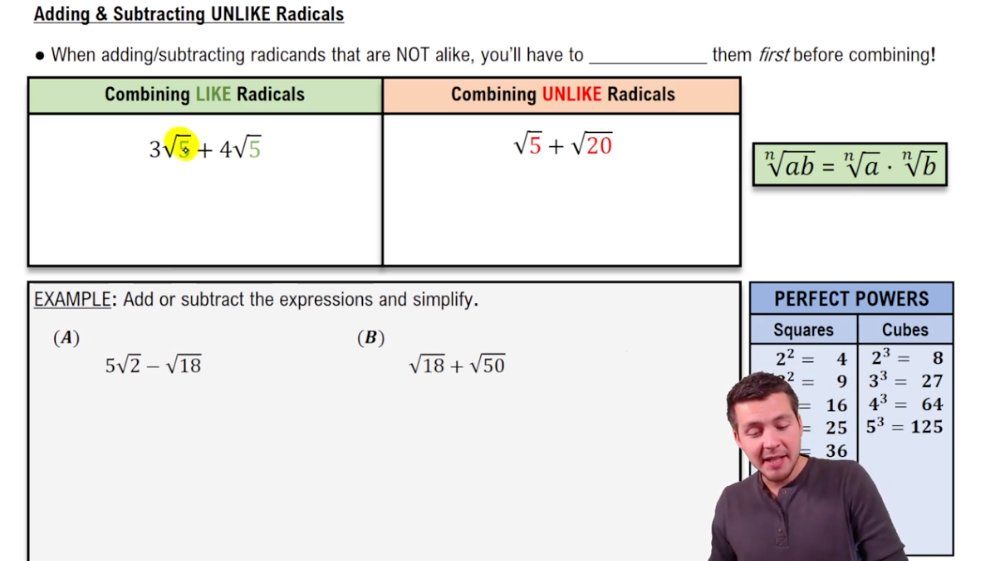
Adding & Subtracting Unlike Radicals by Simplifying
Interval Notation and Sign Analysis
After finding the roots of the quadratic equation, use sign analysis to determine where the quadratic expression is positive or negative. Express the solution set using interval notation, which concisely represents all x-values satisfying the inequality.

 Verified step by step guidance
 3:21
3:21