Identify the given function: \(f(x) = x\). This is a linear function where the output value equals the input value.
Recognize that the graph of \(f(x) = x\) is a straight line passing through the origin (0,0) because when \(x=0\), \(f(x)=0\).
Determine the slope of the line. Since the function is \(f(x) = x\), the slope is 1, meaning the line rises one unit vertically for every one unit it moves horizontally.
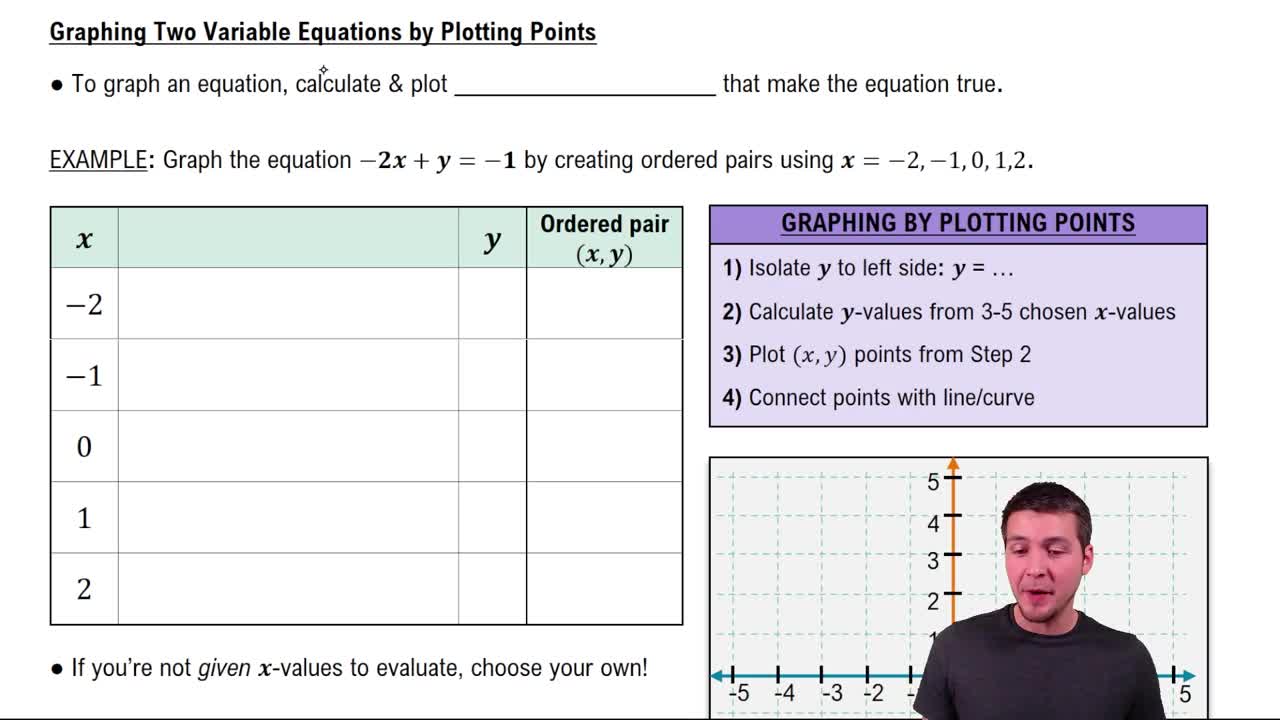
Plot several points to help draw the line accurately. For example, when \(x=1\), \(f(1)=1\); when \(x=2\), \(f(2)=2\); when \(x=-1\), \(f(-1)=-1\).
Draw a straight line through all the plotted points, extending in both directions, to complete the graph of \(f(x) = x\).
Verified video answer for a similar problem:
This video solution was recommended by our tutors as helpful for the problem above
Video duration:
1m
Play a video:
0 Comments
Key Concepts
Here are the essential concepts you must grasp in order to answer the question correctly.
Understanding the Function Notation ƒ(x)
The notation ƒ(x) represents a function named ƒ with input variable x. It means that for each value of x, the function assigns a corresponding output value. Recognizing this helps in interpreting the equation and plotting points on a graph.
A linear function like ƒ(x) = x produces a straight line when graphed. The equation shows that the output equals the input, so the graph passes through points where x and y are equal, forming a line with a slope of 1 and y-intercept at 0.
To graph ƒ(x) = x, plot points where the x-coordinate equals the y-coordinate, such as (1,1), (2,2), and (-1,-1). Understanding how to plot these points on the coordinate plane and connect them helps visualize the function's behavior.

 Verified step by step guidance
 06:08
06:08