Use the graph of y = f(x) to graph each function g. g(x) = ½ f(x)
Verified step by step guidance
1
Step 1: Understand the transformation. The function g(x) = ½ f(x) represents a vertical compression of the graph of f(x) by a factor of ½. This means that all y-values of the original graph will be halved, while the x-values remain unchanged.
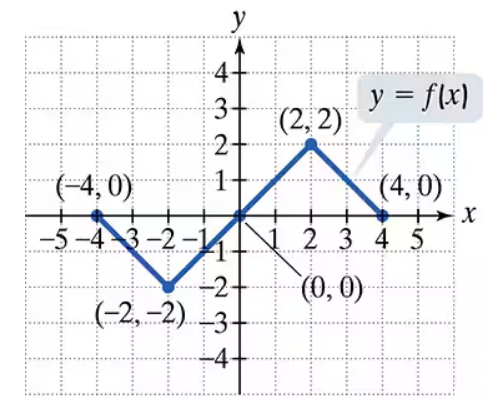
Step 2: Identify key points on the graph of f(x). From the graph, two key points are highlighted: (3, 0) and (0, -27). These points will be transformed according to the rule g(x) = ½ f(x).
Step 3: Apply the transformation to the y-values of the key points. For the point (3, 0), the y-value is 0, and halving it results in 0. For the point (0, -27), the y-value is -27, and halving it results in -13.5.
Step 4: Plot the transformed points on the graph of g(x). The new points after transformation are (3, 0) and (0, -13.5). These points represent the compressed version of the original graph.
Step 5: Sketch the graph of g(x). Use the transformed points and the general shape of the original graph to draw the new graph. Ensure that all y-values are halved while maintaining the same x-values.
Verified video answer for a similar problem:
This video solution was recommended by our tutors as helpful for the problem above
Video duration:
2m
Play a video:
0 Comments
Key Concepts
Here are the essential concepts you must grasp in order to answer the question correctly.
Function Transformation
Function transformation refers to the process of altering the graph of a function through various operations, such as stretching, compressing, translating, or reflecting. In this case, the function g(x) = ½ f(x) represents a vertical compression of the original function f(x) by a factor of 1/2, which means that all y-values of f(x) are halved.
Graphing functions involves plotting points on a coordinate plane to visually represent the relationship between the input (x) and output (y) values of a function. Understanding how to read and interpret the graph of f(x) is crucial for accurately graphing g(x), as it allows one to apply the transformation rules effectively.
Coordinates of points on a graph indicate the specific location of points in the Cartesian plane, represented as (x, y). In the given graph, the points (3, 0) and (0, -27) are significant as they provide reference points for the function f(x). When transforming to g(x), these coordinates will also change according to the transformation applied.

 Verified step by step guidance
 4:22
4:22