
Textbook Question
In Exercises 27–62, graph the solution set of each system of inequalities or indicate that the system has no solution. x2+y2≤1, y−x2>0
-4.">
460
views
 Verified step by step guidanceVerified video answer for a similar problem:
 06:07
06:07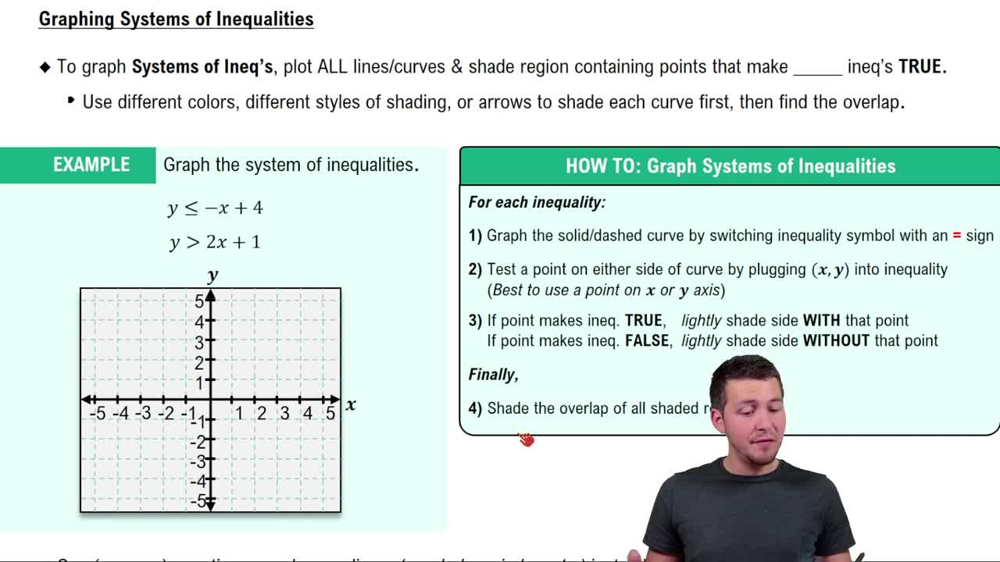 6:19
6:19 06:00
06:00