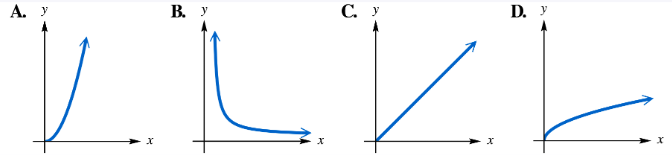
Match each statement with its corresponding graph in choices A–D. In each case, k > 0. y varies directly as the second power of x. (y=kx2)
Verified step by step guidance
1
Identify the type of variation described: "y varies directly as the second power of x" means the relationship can be written as \(y = kx^{2}\), where \(k > 0\).
Recognize the shape of the graph for \(y = kx^{2}\): Since \(k\) is positive and the power of \(x\) is 2, the graph is a parabola opening upwards.
Recall key features of the parabola \(y = kx^{2}\): It is symmetric about the y-axis, passes through the origin (0,0), and as \(|x|\) increases, \(y\) increases quadratically.
Compare the given graph choices A–D to these characteristics: Look for the graph that shows a U-shaped curve opening upwards, symmetric about the y-axis, and passing through the origin.
Match the statement \(y = kx^{2}\) with the graph that fits these features, confirming it represents direct variation with the second power of \(x\).
Verified video answer for a similar problem:
This video solution was recommended by our tutors as helpful for the problem above
Video duration:
2m
Play a video:
0 Comments
Key Concepts
Here are the essential concepts you must grasp in order to answer the question correctly.
Direct Variation
Direct variation describes a relationship where one variable is equal to a constant multiplied by another variable raised to a power. In this case, y varies directly as x squared, meaning y = kx², where k is a positive constant. This implies that as x increases, y changes proportionally to the square of x.
A quadratic function has the form y = ax² + bx + c, and its graph is a parabola. For y = kx² with k > 0, the parabola opens upward and is symmetric about the y-axis. Understanding the shape and orientation of this graph helps in matching the equation to its correct graph.
The constant k in y = kx² affects the steepness or width of the parabola. When k > 0, the parabola opens upward; larger values of k make the parabola narrower, while smaller values make it wider. Recognizing how k influences the graph aids in identifying the correct match among given options.

 Verified step by step guidance
 02:44
02:44