Solve each polynomial inequality in Exercises 1–42 and graph the solution set on a real number line. Express each solution set in interval notation. 4x2 + 1 ≥ 4x
Table of contents
- 0. Review of Algebra4h 18m
- 1. Equations & Inequalities3h 18m
- 2. Graphs of Equations1h 43m
- 3. Functions2h 17m
- 4. Polynomial Functions1h 44m
- 5. Rational Functions1h 23m
- 6. Exponential & Logarithmic Functions2h 28m
- 7. Systems of Equations & Matrices4h 5m
- 8. Conic Sections2h 23m
- 9. Sequences, Series, & Induction1h 22m
- 10. Combinatorics & Probability1h 45m
1. Equations & Inequalities
Linear Inequalities
Problem 70
Textbook Question
In Exercises 69–74, solve each inequality and graph the solution set on a real number line. 2x^2 + 9x + 4 ≥ 0
 Verified step by step guidance
1
Rewrite the inequality in standard quadratic form: \(2x^2 + 9x + 4 \geq 0\). This is already in standard form, so no changes are needed.
Factor the quadratic expression \(2x^2 + 9x + 4\) if possible. Look for two numbers that multiply to \(2 \cdot 4 = 8\) and add to \(9\). These numbers are \(8\) and \(1\). Rewrite the middle term \(9x\) as \(8x + x\): \(2x^2 + 8x + x + 4 \geq 0\).
Group terms in pairs and factor each group: \((2x^2 + 8x) + (x + 4) \geq 0\). Factor out the greatest common factor (GCF) from each group: \(2x(x + 4) + 1(x + 4) \geq 0\).
Factor out the common binomial factor \((x + 4)\): \((2x + 1)(x + 4) \geq 0\). Now the inequality is factored.
Determine the critical points by setting each factor equal to zero: \(2x + 1 = 0\) gives \(x = -\frac{1}{2}\), and \(x + 4 = 0\) gives \(x = -4\). Use these critical points to divide the number line into intervals, test each interval in the inequality, and determine where the product \((2x + 1)(x + 4)\) is greater than or equal to zero. Finally, graph the solution set on the real number line.
 Verified video answer for a similar problem:
This video solution was recommended by our tutors as helpful for the problem above
Video duration:
8mPlay a video:
Key Concepts
Here are the essential concepts you must grasp in order to answer the question correctly.
Inequalities
Inequalities are mathematical expressions that show the relationship between two values when they are not equal. They can be represented using symbols such as '≥' (greater than or equal to), '≤' (less than or equal to), '>' (greater than), and '<' (less than). Understanding how to manipulate and solve inequalities is crucial for determining the solution set of an inequality.
Recommended video:

Linear Inequalities
Quadratic Functions
A quadratic function is a polynomial function of degree two, typically expressed in the form f(x) = ax^2 + bx + c, where a, b, and c are constants. The graph of a quadratic function is a parabola, which can open upwards or downwards depending on the sign of 'a'. Solving inequalities involving quadratic functions often requires finding the roots of the equation, which helps in determining the intervals where the function is positive or negative.
Recommended video:

Solving Quadratic Equations Using The Quadratic Formula
Graphing Solution Sets
Graphing solution sets involves representing the solutions of an inequality on a number line. This visual representation helps to easily identify the intervals that satisfy the inequality. When graphing, closed circles indicate that the endpoint is included in the solution (for '≥' or '≤'), while open circles indicate that it is not included (for '>' or '<'). Understanding how to accurately graph these intervals is essential for conveying the solution clearly.
Recommended video:

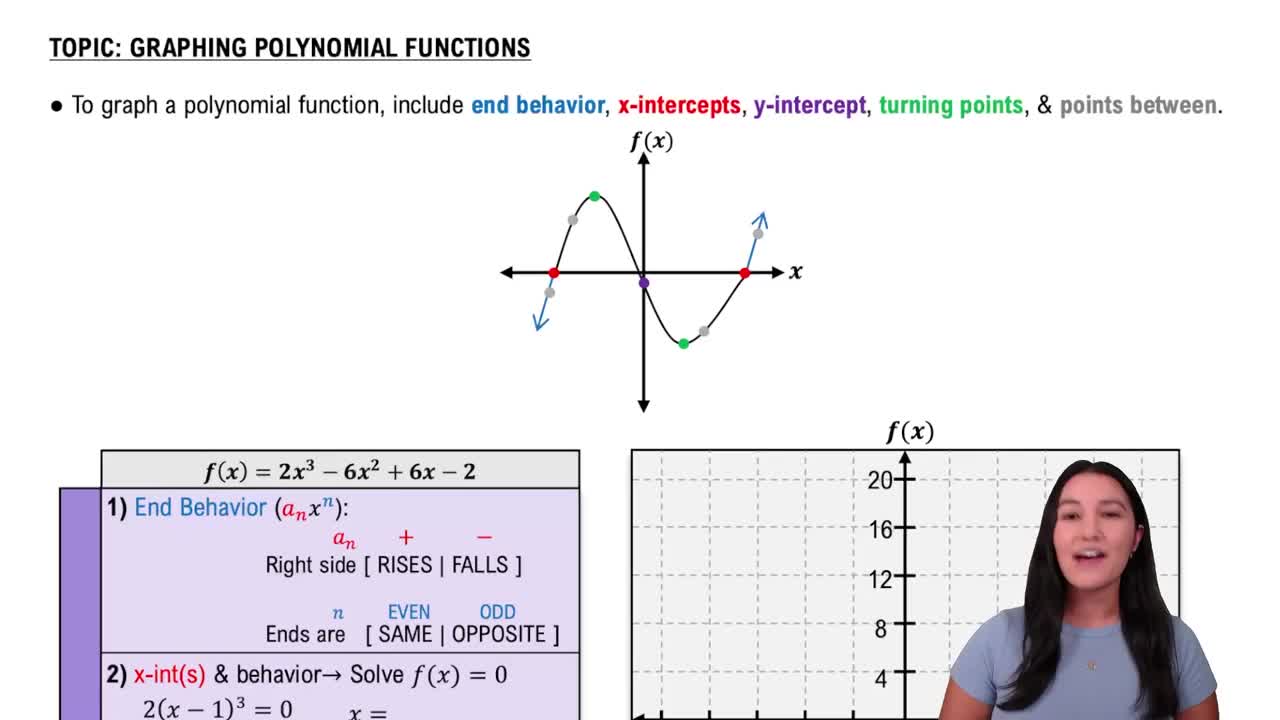
Graphing Polynomial Functions
Related Videos
Related Practice
Textbook Question
453
views


