Join thousands of students who trust us to help them ace their exams!
Multiple Choice
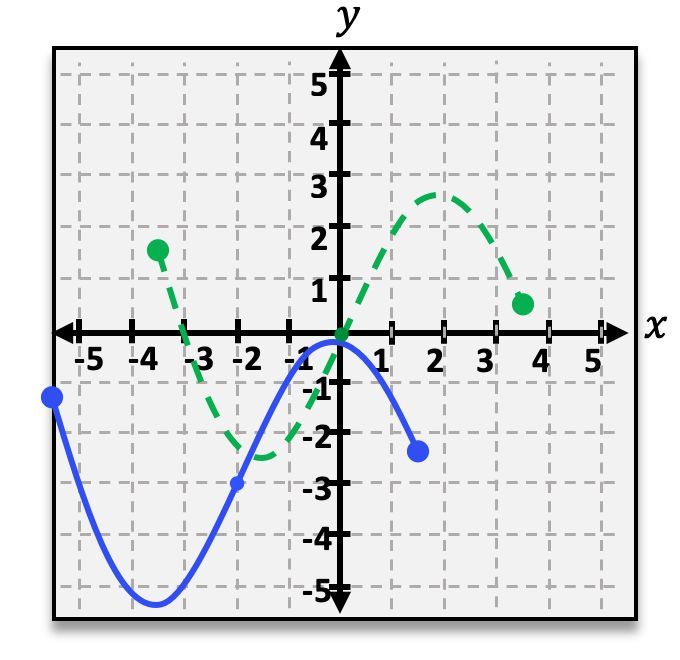
The green dotted line in the graph below represents the function f(x). The blue solid line represents the function g(x), which is the function f(x)after it has gone through a shift transformation. Find the equation for g(x).
A
g(x)=f(x−2)+3
B
g(x)=f(x−2)−3
C
g(x)=f(x+2)−3
D
g(x)=f(x)−3
0 Comments
Verified step by step guidance
1
Identify the transformation from the graph: The green dotted line represents f(x), and the blue solid line represents g(x). Notice that the blue line is a horizontal shift to the left and a vertical shift downward from the green line.
Determine the horizontal shift: The graph of g(x) is shifted 2 units to the left compared to f(x). This means the transformation involves replacing x with (x + 2) in the function f(x).
Determine the vertical shift: The graph of g(x) is shifted 3 units downward compared to f(x). This means the transformation involves subtracting 3 from the function f(x).
Combine the transformations: The horizontal shift of 2 units to the left and the vertical shift of 3 units downward can be combined into the transformation g(x) = f(x + 2) - 3.
Verify the transformation: Check that the transformation g(x) = f(x + 2) - 3 correctly describes the shift observed in the graph, ensuring that the blue line is indeed the result of shifting the green line 2 units left and 3 units down.


 Verified step by step guidance
