Identify the polynomial function given: \(f(x) = 2x^3 + x^2 - x\).
Find the x-intercepts by setting \(f(x) = 0\) and solving the equation \$2x^3 + x^2 - x = 0$. Factor the polynomial to find the roots.
Determine the y-intercept by evaluating \(f(0)\), which is the constant term or the value of the function when \(x=0\).
Find the critical points by computing the first derivative \(f'(x)\) and setting it equal to zero: \(f'(x) = \frac{d}{dx}(2x^3 + x^2 - x)\). Solve \(f'(x) = 0\) to find potential maxima, minima, or points of inflection.
Use the critical points and intercepts to sketch the graph, considering the end behavior of the cubic function (as \(x \to \pm \infty\), \(f(x) \to \pm \infty\) depending on the leading term).
Verified video answer for a similar problem:
This video solution was recommended by our tutors as helpful for the problem above
Video duration:
10m
Play a video:
0 Comments
Key Concepts
Here are the essential concepts you must grasp in order to answer the question correctly.
Polynomial Functions
A polynomial function is an expression consisting of variables raised to whole-number exponents and coefficients combined using addition, subtraction, and multiplication. Understanding the degree and leading coefficient helps predict the general shape and end behavior of the graph.
Cubic functions are polynomial functions of degree three, typically having an S-shaped curve. Key features include intercepts, turning points, and end behavior, which depend on the sign and magnitude of the leading coefficient.
To graph a polynomial, find the x-intercepts by solving ƒ(x)=0 and the y-intercept by evaluating ƒ(0). Critical points, found by setting the derivative equal to zero, indicate local maxima or minima, helping to sketch the curve accurately.

 Verified step by step guidance
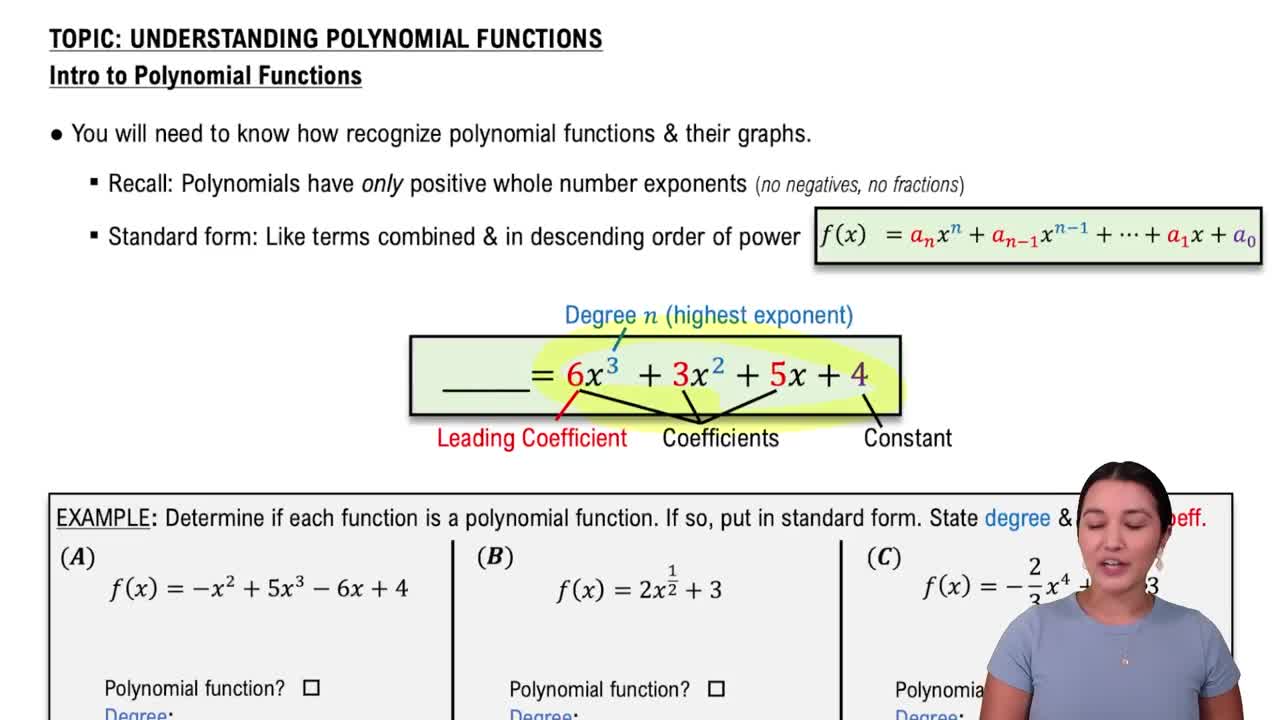
 06:04
06:04